BullMarketRun   BullMarketRun.com

A Daily, Vibrant Voice Focused on Speculative Opportunities,
Commodities, and Economic & Political Trends Impacting
The Resource Sector & Equity Markets
 

"Market-Trouncing Returns Through Unbeatable
Technical & Fundamental Analysis of Niche Sectors"

February 21, 2014

BMR Morning Market Musings…

Gold has traded between $1,315 and $1,325 so far today…as of 7:45 am Pacific, bullion is down $1 an ounce at $1,322…Silver is off 7 cents at $21.75…Copper is flat at $3.26…Crude Oil has eased 40 cents to $102.35 while the U.S. Dollar Index has dropped one-tenth of a point to 80.22…

Holdings of the largest Gold-backed ETF, SPDR Gold Trust GLD, dropped 0.7% on Wednesday from Tuesday, and the largest Silver-backed ETF, iShares Silver Trust SLV, was unaltered during the same period…

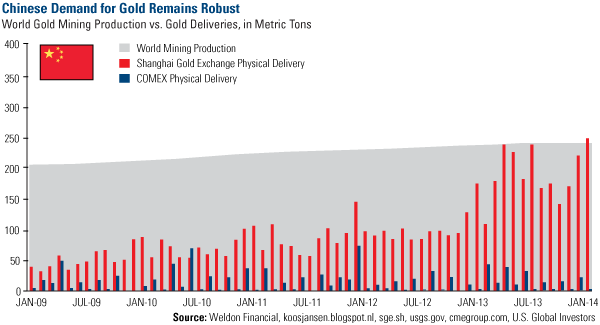
Switzerland sent more than 80% of its Gold and Silver bullion and coin exports to Asia last month, the Swiss Federal Customs Administration said today in an emailed report…it imported most from the U.K….Hong Kong was the top destination at 44% on a value basis, with India at 14%, the Bern-based customs agency said in its first breakdown of the Gold trade data since 1980…Singapore accounted for 8.6% of exports, the United Arab Emirates 7.9% and China 6.3%…China, in turn, is importing from Hong Kong…this is another example of the shift Gold holdings from west to east…

Chinese Refined Copper Imports Jump

Chinese imports of refined Copper surged around a quarter in January from the month before to their second-highest on record, as buyers brought shipments due to the Lunar New Year in February and with investors increasing spot purchases as a financing tool…customs data today showed that the world’s top consumer and producer of refined Copper imported 397,459 tonnes of refined metal in January, compared to a record 406,937 tonnes in December 2011…January imports rose 63.5% from a year ago and beat forecasts by traders and analysts who had anticipated lower arrivals in January as many factories close from the middle of that month due to the Lunar New Year holidays…

Today’s Markets

Asia

Japan’s benchmark Nikkei has snapped a six-week losing streak, posting its biggest weekly gain since in nearly three months…the Nikkei surged 416 points to close at 14866…

China’s Shanghai Composite slipped 25 points, however, to close at 2114…yesterday’s Chinese manufacturing data ran counter to numbers released in the past two weeks that showed unexpected strength in the country’s economy…Chinese foreign direct investment rose more than 16% on year in January, the country’s ministry of commerce said Tuesday…on February 12, trade data showed an unexpected surge in Chinese imports and exports last month, another sign of economic health…overall, the recent robust data from China, along with concerns of a flagging U.S. recovery, have helped Gold prices gain more than 9% this year…many investors, however, have taken the positive Chinese data with a grain of salt, acknowledging that they may be prone to distortions…the weakness in the U.S. numbers, on the other hand, has been partially blamed on frigid weather throughout much of the country in December and January…

Europe

European markets are modestly higher in late trading overseas…

North America

The Dow is up 42 points as of 7:45 am Pacific while the TSX has added 39 points…we’re devastated about this – Tim Hortons Inc (THI, TSX) has decided to pull Cold Stone Cremery from its Canadian outlets…the ending of the five-year ice cream partnership in Canada came as Tim Hortons missed analyst profit estimates in latest quarter…“While [Cold Stone] is an excellent brand and a very high-quality product offering, we have determined that the fit was not ideal with our strategy of price, value and speed in the Canadian restaurants,” chief executive officer Marc Caira told a conference call with analysts…

On the B.C. exploration scene, Pretium Resources Inc. (PVG, TSX) has arranged a $20 million flow-through financing at $8.05 and $8.80 per share… meanwhile,  Thompson Creek Metals Company Inc. (TCM, TSX) has reported that its Mt. Milligan Copper and Gold mine has achieved commercial production this week…

TSX Updated Chart

The TSX is at a critical point…as you can see in this 9-month daily chart from John, the Index is threatening to break out above an upsloping channel…it has traded within this channel since last summer…

Venture Update

The Venture, which has performed incredibly well on Fridays for the past several months, continues to gain traction above the psychologically important 1000 level…it’s up another 4 points to 1019 through the first hour of trading today…NexGen Energy Ltd. (NXE, TSX-V) continues to push higher after reporting a discovery Wednesday at its Rook 1 uranium project…it opened at 48 cents and quickly surged from there, reaching an all-time high of 65 cents in early trading…it has backed off slightly since and is up 9 cents at 56 cents as of 7:45 am PacificEskay Mining Corp. (ESK, TSX-V), which we mentioned Tuesday when it was trading at 6 cents, has broken above resistance at 7.5 cents…it’s up 5.5 cents at 12.5 cents on Venture volume of 230,000 shares as of 7:45 am Pacific

More Moves In The Sheslay Valley:  Alix Resources Corp. (AIX, TSX-V) Acquires Claims Contiguous To Northern Borders of Sheslay, Grizzly & Hat

An interesting development this morning in the Sheslay Valley area play…we thought others had the inside track on this, but upstart Alix Resources (AIX, TSX-V) has acquired strategic claims from a private company contiguous to the entire northern border of Prosper Gold Corp.’s (PGX, TSX-V) Sheslay Project, the northwestern corner of Garibaldi Resources Corp.’s (GGI, TSX-V) Grizzly Property, and the northern border of Doubleview Capital Corp.’s (DBV, TSX-V) Hat Property…a “hat trick”, so to speak, for Alix…this news just hit the wire a few moments ago…AIX is up half a penny at 3.5 cents as of 7:45 am Pacific…we’ll have a chance to report on the significance of these claims Monday…

In the meantime, below is a “big picture” view of AIX from a technical perspective with a 4-year weekly chart just produced…the ADX indicator shows a bullish overall trend, the 50-day SMA has reversed to the upside after being in decline since November, and RSI(14) is well positioned to climb higher…there is chart resistance at 5 cents…as always, perform your own due diligence…

Probe Mines Ltd. (PRB, TSX-V)

Probe Mines (PRB, TSX-V) has eased off a bit from its recent all-time high of $3.40…any pullbacks in PRB since the second quarter of last year have consistency proven to be buying opportunities…earlier this week, the company reported more excellent drill results from its Borden Lake Gold Project in northern Ontario…holes BL14-582, 583, 584 and 586 are of particular importance as they demonstrate increasing grades at shallow depths (220 to 250 metres) within the northwest end of the HGZ (sections 950mSE to 1100mSE) and indicate that the HGZ is still improving within its known strike length…

Below is an updated 2.5-year weekly chart from John…there was a confirmed breakout recently above Fib. resistance at $2.99, so that area should now provide strong support…PRB is off a nickel at $3.10 through the first 75 minutes of trading…

Sante Fe Metals Corp. (SFM, TSX-V)

Pinetree Capital (PNP, TSX-V) has been been forced to liquidate some of its holdings recently to raise cash levels, and rumor has it that Sante Fe Metals (SFM, TSX-V) was one of the victims of Pinetree selling in recent days…technically, on the daily chart, SFM has become quite oversold and in the fact the RSI(2) shows extreme oversold conditions…as a result, bargain hunters may wish to take a look at SFM as we believe it will recover as the company prepares for another drill program at its Sully Project in southeast British Columbia…SFM is focusing on two large-scale, vertical and parallel sedimentary exhalative (sedex) targets…both the east and west targets are located within the broad four-kilometre-by-three-kilometre Sully gravity anomaly that has been the focus of exploration drilling to date…the name of the property is derived from the world-class Sullivan mine sedex deposit, located at Kimberley, 27 km west of Sully…

Below is a “big picture” 3-year weekly SFM chart from John…critical support at 3 cents held this week despite the dumping of shares which our research shows is likely over…

Mason Graphite Ltd. (LLG, TSX-V) Updated Chart

Note: John and Jon hold share positions in GGI, DBV and AIX.  Jon also holds a share position in PGX.

February 20, 2014

BMR Morning Market Musings…

Gold has traded between $1,307 and $1,318 so far today…as of 7:50 am Pacific, bullion is up $4 an ounce at $1,315…Silver is 21 cents higher at $21.75…Crude Oil has retreated 25 cents to 103.06 while the U.S. Dollar Index is up one-tenth of a point to 80.30…

UBS AG has boosted forecasts for Gold in 2014, citing a change in U.S. investors’ attitudes toward the precious metal that’s rallied this year on increased haven demand and buying from Asian consumers…the one-month forecast was raised to $1,280 an ounce from $1,180, while the three-month outlook was increased to $1,350 from $1,100, analysts Edel Tully and Joni Teves said in a report…Gold may average $1,300 in 2014 from a previous estimate of $1,200, they said, while holding the 2015 target at $1,200…

Check out the excellent article yesterday by Mineweb’s Lawrence Williams (www.mineweb.com) on the potential impact on Gold of an ETF reversal this year after major outflows in 2013…“If we assume ETF sales become a net zero this year, which is certainly possible, that immediately takes 880.8 tonnes off the market and if Eastern demand remains at anything like 2013 levels that is going to create a huge shortage in physical Gold supply,” Williams wrote…

WTIC Updated Chart

For the past four years Crude Oil (WTIC) has traded within an ascending triangle, so predicting good entry points like late last year has been quite easy…at some point, though, Crude is either going to break below the ascending triangle and trade lower, or it’s going to push through the post-Crash resistance level of $110…the implications for Gold, either way, will be significant…

Today’s Markets

Asia

Japan’s Nikkei extended losses from the previous day, giving up 317 points or 2.2% to close at 14449 following trade data…the country logged a record monthly trade deficit in January, despite a weaker yen which in theory should make the country’s exports more competitive…on the export side, many point to the declining competitiveness of Japan’s consumer electronics industry and a steady outflow of manufacturing capacity to foreign countries…

China’s Shanghai Composite was off 4 points to finish at 2139…China’s factory activity lost ground in February as a key gauge of manufacturing slipped to a seven-month low, once again stirring concerns over the health of the world’s second-largest economy…the preliminary HSBC China Manufacturing Purchasing Managers’ Index, a gauge of nationwide manufacturing activity, fell to 48.3 in February from 49.5 in January – the second straight month the PMI has been below 50, which signals contraction…

Europe

European stocks are mixed in late trading overseas…fresh economic figures from France were disappointing…consumer price inflation for the country posted a worse-than-expected dip of 0.6% for January, whereas Markit PMI for February showed a slide from last month…

North America

The Dow has climbed 58 points through the first 80 minutes of trading today…the Fed has held short-term interest rates near zero since December 2008 but, interestingly, a “few” Fed officials argued at the January 28-29 policy meeting that increases might be needed soon to prevent the economy from overheating, according to minutes of the meeting released yesterday…these officials were most likely from the Fed’s band of policy “hawks” who have largely failed in resisting the central bank’s easy-money policies…

The TSX is 74 points higher while the Venture is flat at 1006 as of 7:50 am Pacificthe Athabasca uranium play heated up on a couple of fronts yesterday…NexGen Energy Ltd. (NXE, TSX-V) nearly doubled on total volume (all exchanges) of 7.5 million after reporting that it has discovered a new zone of uranium mineralization at its Rook 1 Project, unrelated to any other known occurrence in the region…hole RK-14-21 (the first hole drilled at “Arrow”) is still in progress…26.2 m of highly anomalous radioactivity was intersected between 204.8 m and 231 m downhole…NXE is off 1.5 cents at 41.5 as of 7:50 am Pacific

Fission Uranium Corp. (FCU, TSX-V)

More spectacular high-grade results from Fission Uranium (FCU, TSX-V) at its PLS Property, and the stock responded well by climbing 8 cents to close at $1.27 on total volume (all exchanges) of 16.5 million shares…what investors should look for today is a potential confirmed breakout above the $1.25 chart resistance as shown in this 6-month daily chart from John…FCU is up a penny at $1.28 in early trading…


Colorado Resources Ltd. (CXO, TSX-V) Update

Colorado Resources’ (CXO, TSX-V) turnaround started December 20 when the company announced it had assembled a 300 sq. km land package (the “KSP” Property) 15 km along strike to the southeast of the past producing Snip mine which, from 1991 to 1999, produced over one million ounces of Gold at a recovered head grade of 24.5 g/t (KSP is also about 40 km west of the prolific former producing Eskay Creek mine)…this is another area of B.C. to watch closely in the coming monthsCXO’s exploration program will be aided both by new geological models developed in the Kerr sulphurets camp by both Seabridge Gold Inc. (SEA, TSX) and Pretium Resources Inc. (PVG, TSX) as well as by recent infrastructure development which has brought roads and power lines to the area’s doorstep…Garibaldi Resources Corp’s (GGI, TSX-V) King Property, which has returned high-grade Silver and Zinc numbers from sampling, is also in the heart of this district…

Colorado will be following up this year on its North ROK Property near Iskut but it appears the market prefers the scale and potential of its newly acquired package…below is a 14-month weekly CXO chart from John…the stock clearly bottomed in December at 14 cents…it staged an unconfirmed breakout yesterday above an ascending triangle and chart resistance at 34 cents, so today’s trading activity will be interesting to see if that breakout is indeed confirmed…next major chart resistance is at 45 cents while strong support exists at 25 cents, a penny above the rising 50-day moving average (SMA)…


Doubleview Capital Corp. (DBV, TSX-V) Update

Doubleview Capital (DBV, TSX-V) weakened yesterday, falling below its 20-day SMA for the first time in over two months but in the context of a rise from a December low of 4 cents to a February all-time high of 30 cents, the pullback is normal and healthy from a technical standpoint…it also presents a second chance for investors to jump in at favorable levels prior to another potential major advance in DBV, the catalyst for which could be the commencement in the near future of a new phase of drilling to follow up on the company’s important discovery at the Hat Property reported January 20…these are still the early stages of the Sheslay Valley area play, and the time to get positioned is before the masses start piling in – otherwise you face the prospect of chasing some of these stocks at much higher prices…as always, perform your own due diligence…

When you look at DBV’s drill hole locations and results – the nearly one km horizontal distance from mineral zones in H-6 to H-8, and the fact that H-8 and H-11 ended in strong Cu-Au mineralization – the Hat is clearly showing volume and grade potential, and DBV has some very inviting initial targets to go after once the next round of drilling starts…we’ll get more into the significance of the map below in the days ahead, particularly in Part 2 of our feature on DBV, but we can’t help but like what we see below…

Geophysics and geochemical work have outlined several significant target areas at the Hat – only targets A and B have been tested to date by drilling (11 holes only).

Updated DBV Chart

Below is a 3-month daily DBV chart from John…importantly, RSI(14) is now landing on previous support…a very strong band of price support also exists between 15 cents and 18 cents, so it wasn’t surprising to see bargain hunters step in this morning with bids when DBV touched 18.5 cents…a bullish downsloping flag bodes well…


Canada Zinc Metals Corp. (CZX, TSX-V)

A good opportunity in our view is opening up in Canada Zinc Metals (CZX, TSX-V) which has backed off, as John suspected it would…CZX is yet another very interesting B.C. play…the company is a dominant landholder in the Kechika Trough featuring several known Zinc-Lead-Silver deposits including the company’s Cardiac Creek deposit which has a NI-43-101 resource…Cardiac Creek forms one of CZX’s two 100%-owned projects – the other is the Kechika Regional which holds significant exploration upside…CZX announced some FT financing Tuesday and is down 6 cents at 45 cents as of 8:00 am Pacific…strong technical support in the low ’40’s as shown in this 3-year weekly chart…

Note: John and Jon both hold share positions in GGI and DBV.

February 19, 2014

BMR Morning Market Musings…

Gold has traded between $1,314 and $1,324 so far today…as of 7:20 am Pacific, bullion is down $1 an ounce at $1,318…Silver is off a dime at $21.86…Crude Oil (WTI) is up another 47 cents to $102.90 as inventories continue to shrink due to cold weather…Copper is flat at $3.27 while the U.S. Dollar Index is up slightly at 80.08…

According to a report in the Wall Street Journal this morning, based on information from a senior government official, India is likely to cut the import tax on Gold before the end of next week by between 2% and 4% from the current level of 10%India’s government had gradually raised the import tax on Gold to 10% from 2% since early 2012 to bring down a current-account deficit…it tightened restrictions further last year by asking importers to re-export at least 20% of the Gold they bring into the country…winds of political change are blowing in India, and this could lead to a further easing of rules on Gold imports after national elections in June…the restrictions have led to a sharp rise in smuggling of Gold through India’s airports, seaports and by land from its neighbors Nepal and Bangladesh…nearly all the Gold consumed in India has to be imported and official supplies through banks have nearly dried up…the shortage of Gold has hit the livelihood of hundreds and thousands of small jewelry retailers and artisans employed in the industry, and the current government is feeling pressure from that…

In a sign of the times, a Chinese-controlled bank is in line for a rare seat at the table of the small club of lenders that sets the global benchmark price for Gold…London-based Standard Bank PLC, in which Chinese state-owned Industrial & Commercial Bank of China Ltd. acquired a 60% stake last month, is the apparent front-runner to buy Deutsche Bank AG’s position on the panel of five banks that sets the daily Gold benchmark…in January, Deutsche Bank said it was pulling out of the fixing panel as part of a wider move to scale back its involvement in commodities…

U.S. Dollar Index Updated Chart Bullish For Gold

A struggling U.S. Dollar Index has been one of our major themes at BMR since September, and continued weakness in the greenback supports the idea of even higher Gold prices and a healthy Venture

John’s latest 2.5-year weekly U.S. Dollar Index chart isn’t good news for stubborn dollar bulls – at the very least, the Index is likely to test critical support this quarter at 79…yesterday, it broke below the Fib. 38.2% support level…what’s particularly interesting is that one cannot rule out the possibility of a breach of that crucial 79 area in the Dollar Index at some point this year – if that support fails, Gold cold really take off…


Consumer Confidence In China At Record Levels

Consumer confidence in China picked up in the final quarter of 2013, according to a survey by data provider Nielsen published today…Nielsen’s consumer confidence index hit a record 111…“Thanks to a stabilized GDP growth rate, a resilient labor market and steady household income growth, Chinese consumer confidence grew in the last quarter of 2013,” Nielsen Greater China President Yan Xuan said…better job prospects and stronger spending intentions are the most important factors in the improvement, he said…there were 3,500 respondents to the Nielsen survey from all areas of China…compared with other countries, China ranked fourth in consumer confidence…Indonesia is #1…

Today’s Markets

Asia

China’s Shanghai Composite was strong overnight, hitting a 9-week high as it climbed 23 points to close at 2143…investors took relief from lower money market rates a day after the People’s Bank of China drained $8 billion from money markets…the benchmark 7-day repo rate traded around 3.5%, indicating that liquidity levels remain ample…Japan’s Nikkei average slipped 77 points, finishing at 14767…

Europe

European markets are mixed in late trading overseas…

North America

The Dow is up 88 points as of 7:20 am Pacific…U.S. housing starts, impacted by harsh weather, recorded their biggest drop in almost three years in January…the third month of declines in permits, however, points to some weakness creeping into the housing market…

The TSX is up 86 points through the first 50 minutes of trading while the Venture, aiming for its ninth consecutive winning session, is up another 8 points to 1010…Fission Uranium (FCU, TSX-V) and NexGen Energy Ltd. (NXE, TSX-V) were each halted prior to the open, pending news, so uranium plays could be hot today...Integra Gold (ICG, TSX-V) has hit some more high-grade in drilling at its Lamaque Gold Project near Val d’Or with the stock up 2 cents at 34 cents as of 7:20 am Pacific…the company is carrying out an aggressive drill program at Lamaque  – three rigs are still active on the property, so speculation regarding future results should keep this play active…

Detour Gold Arranges $150 Million Bought Deal

This has to be viewed as a positive sign for the industry – Detour Gold Corp. (DGC, TSX) has arranged a $150 million bought deal financing with a syndicate of underwriters, led by BMO Capital Markets and RBC Capital Markets, who have agreed to buy 16.22 million common shares of Detour at a price of $9.25 per share (an overallotment option could take the deal as high as $172.5 million)…the company intends to use up to half of the net proceeds of the offering to reduce short-term debt levels and the remainder for working capital purposes…

Tinka Resources Ltd. (TK, TSX-V)

Tinka Resources (TK, TSX-V) appears to be on the rebound after a breakout yesterday that requires confirmation today…the company holds two Silver-Lead-Zinc projects in west-central Peru, and yesterday came out with drill results from one of them (Ayawilca) that included 36 metres grading 5.9% Zn (hole A14-18)…that hole is on the edge of two large, coincidental magnetic and chargeability anomalies at Ayawilca that have not yet been drill tested…

Technically, TK yesterday finally broke above a downtrend line in place for a year but that doesn’t necessarily mean it’s ready just yet for a powerful, sustained advance…it does have a stiff band of resistance to deal with between 45 cents and the mid-50’s as you can see on John’s chart below…worth watching closely, though, especially if you’re bullish on Silver and Zinc as we are…


Radius Gold Inc. (RDU, TSX-V) Chart – A Microcosm Of The Venture

The Radius Gold (RDU, TSX-V) chart is a great illustration of how the Venture has turned the corner – a bottom last June in RDU at 7 cents, a breakout above a long-term downtrend line, a re-test of that downtrend line as support, and then another surge to the upside…this kind of a pattern is extremely bullish and bodes well not only for RDU this year, but the market as a whole…there will be volatility but the overall trend is now clearly bullish with the bear market now behind us…


WANTED Technologies Corp. (WAN, TSX-V)

While we remain focused almost exclusively on the resource sector, occasionally we come across a non-resource company that really intrigues us…a good example is WANTED Technologies Corp. (WAN, TSX-V) which we selected in late December as one of 20 plays to watch closely in 2014…yesterday, WAN reported strong results for the quarter ending December 31 (the company’s second quarter of fiscal 2014) with net income of 4 cents per share…revenues were $2,360,917, an increase of 37% compared to the second quarter of fiscal 2013…excluding a significant one-time, non-recurring revenue agreement in the quarter, revenues grew 21% over the prior year…net income was just over $1 million compared to net income of $331,808 in the second quarter of fiscal 2013…

Since 2005, WANTED has stored more than one billion detailed records on hiring activity throughout the U.S. and Canada…this proprietary database contains more than 100 billion data elements which are used for analytical applications throughout multiple business sectors…the company’s most recent significant license agreement is one of many applications of WANTED’s “big data” for the employment sector…the challenge for WANTED will be to remain innovative while pursuing its growth in a relatively new and competitive field…new players, new alliances and new technological solutions may very well emerge in this market…

John’s updated 2.5-year weekly chart for WAN shows a cleansing of the overbought RSI(14) condition that emerged late last year…important support held, and the next major resistance levels are $1.55 and around $2…WAN if off a penny at $1.37 as of 7:20 am Pacific

Note: John, Jon and Terry do not hold share positions in any of the above mentioned stocks.

February 18, 2014

BMR Morning Market Musings…

Not surprisingly, Gold is pulling back modestly today after last week’s $50+ jump and some follow-through buying yesterday on President’s Day in the U.S. and Family Day in much of Canada…as of 7:45 am Pacific, bullion is down $6 an ounce at $1,323 after dipping as low as $1,312…Silver is off just 3 cents at $21.81 (see updated Silver charts at bottom of today’s Morning Musings)…Copper is up a penny at $3.28…Crude Oil has surged by more than $1 a barrel to $101.38 while the struggling U.S. Dollar Index is down nearly one-fifth of a point to 79.98…

Total global demand for Gold fell in 2013 as outflows from exchange-traded funds more than offset robust consumer buying, the World Gold Council reported today…otherwise, the WGC said, jewelry demand for Gold climbed back to pre-financial-crisis levels and investments in small bars and coins hit a record high…

After smashing through important resistance around $1,275 and climbing more than $50 an ounce last week, Gold’s next major hurdle is the $1,350 area where it got pushed back from in late October…bullion has shot above its 200-day moving average (SMA) for the first time in more than a year…reports show that the Federal Reserve began 2014 with a sharp increase in M2 money supply…in addition, Gold ETF holdings are showing a net increase of 22,000 ounces so far this month, reversing the large redemptions from last year…with a stabilization in the ETF market, robust physical demand from China, a weak U.S. Dollar Index, more potential short-covering, and improved technicals, any pullback in Gold is likely to be modest with strong new support in the $1,270’s…

China’s Growing Appetite For Gold

As you can see in this chart from www.usfunds.com, January marked a record level of Gold deliveries on the Shanghai Gold Exchange (246 tons which exceeded world mining production for the month) as bullion continues to move from west to east…the Chinese were saying “thank you very much” when the west was dumping its Gold last year – won’t be easy for the west to get it back…

Chinese Demand for Gold Remains Robust

China has officially taken over the throne as the world’s top Gold-consuming nation, the WGC reported today…“We’ve had quarters where China has been the No. 1 market overall,” stated Marucs Grubb, managing director for investment strategy at the WGC. “But 2013 is the first calendar year where China has been No. 1, in recent decades anyway.” Collectively, China and India accounted for more than half of global Gold demand last year, according to the WGC’s data…officially, China purchased a record 1,065.8 metric tons during 2013, a year-on-year surge of 32%…the WGC stated that Indian demand was “resilient” despite import restrictions…

Today’s Markets

Asia

Japan’s Nikkei average surged 3.1% overnight, climbing 450 points to close at 14834…the Bank of Japan left monetary policy steady at the conclusion of its two-day meeting and said it will extend a special lending program by one year to support the economy…China’s Shanghai Composite slipped 16 points to finish at 2119…foreign direct investment in China rose an annual 16.1% in January…HSBC flash purchasing managers’ index (PMI) for February will be released Thursday…

Europe

European markets are mixed in late trading overseas…U.K. inflation fell below the Bank of England’s target in January to its lowest annual level (1.9%) since November 2009…

North America

The Dow is down 11 points as of 7:45 am Pacific…the TSX is 32 points higher while the Venture has crossed the 1000 level, up 5 points at 1002…

Venture 3-Year Weekly Chart

Below is John’s updated 3-year weekly chart for the Venture…a very significant confirmed breakout through the 970’s occurred last week…numerous attempts over the last 10 months to overcome that wall of resistance failed…the next major chart resistance is around 1150 as shown on the Venture 5-year weekly we posted Saturday as part of the Week In Review And A Look Ahead…

As you can see on this 3-year chart, which also includes Gold, the Venture’s turnaround really started in October when it broke above a long-term downtrend line which then became new support over the next couple of months…that support was tested repeatedly until just before Christmas when the Index took the path of least resistance and headed north…encouragingly, RSI(14) now has support at 50% (previous resistance since the bear market began in early 2011) and certainly has room to move higher…


Eskay Mining Corp. (ESK, TSX-V)

It’s a certainty that northwest British Columbia is going to be a hot exploration area this year, all the way up to the Sheslay Valley and beyond…on that note, another company we suggest our readers perform their due diligence on is Eskay Mining Corp. (ESK, TSX-V)…ESK controls 40 sq. km surrounding the prolific past producing Eskay Creek mine, and they have some giant neighbors – Pretium Resources Inc. (PVG, TSX) and Seabridge Gold Inc. (SEA, TSX)….while it was in operation, Eskay Creek was the second richest deposit in North America and the fifth largest Silver producer in the world…a technical adviser for ESK is the highly respected James Rogers, P.Geo., who was Chief Geologist at the Eskay Creek mine between 1994 and 2003…Rogers prepared an ESK corporate presentation which is available on their web site – we suggest our readers check it out…

Technically, what’s interesting about ESK is that it’s threatening to push above a long-term downtrend line after finding rock-solid support at 3 cents…recently, there has been a volume surge in the stock which caught our attention, and the company also granted three million stock options at a nickel…below is a 5-year weekly chart from John…

Doubleview Capital Corp. (DBV, TSX-V) Continues To Fill Its Treasury

More encouraging news from Doubleview Capital Corp. (DBV, TSX-V) this morning as the company has now crossed the $500,000 mark in proceeds raised from the exercise of warrants…in total so far, 2,616,666 warrants have been exercised at 15 cents while 1.38 million warrants have been exercised at 10 cents for gross proceeds of $530,500…just over 16 million share purchase warrants are still outstanding, so DBV has an excellent chance of enlarging its bank account even more in the days ahead…this is an important development as it gives the company the opportunity to proceed quickly with the next phase of drilling at the Hat Property in order to follow up on the discovery holes reported last month…a warming trend is developing in the Sheslay Valley which may create suitable drilling conditions for DBV next month…

Technically, DBV has been consolidating in a 2-week pennant which constitutes a bullish flag…strong Fib. support exists at 23 cents…

We continue to work on “Part 2” of our special report series on DBV, and we’ll be posting that in the near future…

Garibaldi Resources Corp. (GGI, TSX-V) Update

While much attention is being given, and deservedly so, to Garibaldi Resources’ (GGI, TSX-V) Grizzly Property in the Sheslay Valley, along comes “Mexico Mike” to remind everyone of the value of GGI’s assets in Mexico…interviewed by The Gold Report (www.theaureport.com), Kachanovsky (consultant to hedge funds and mining companies and contributor to SmartInvestment.ca) stated, Garibaldi has a core group of holdings in Mexico that the company is currently drilling in proximity to large-scale mines in Mexico. Any drill-bit success that it accomplishes could become a very attractive takeover target. Garibaldi is unique in that earlier in the cycle it did just that. It found a large Gold and Silver deposit, which it successfully vended to another company, making a lot of money for its shareholders. The company has done a very good job of managing its cash position.”

Below is an updated 3.5-year weekly GGI chart from John…a bullish flag has formed in GGI…

Abcourt Mines Inc. (ABI, TSX-V)

A small junior producer in Quebec that will clearly benefit from a weak Canadian dollar and firmer Gold and Silver prices is Abcourt Mines (ABI, TSX-V) which is close to pushing its Elder Mine near Rouyn-Noranda into the commercial production phase…the company also has a significant Silver resource at another nearby property…

We have two charts this morning on Abcourt that our readers should find quite helpful as part of their due diligence…immediately below is a 10-year monthly chart…note how support has held at 5.5 cents, and how close ABI is to breaking out above a long-term downtrend line…

ABI 2-Year Weekly Chart

What’s revealing about this 2-year weekly chart is the very strong accumulation in ABI since the fourth quarter of last year...immediate resistance is at 8 cents…

Barisan Gold Corp. (BG, TSX-V) Chart Update

Readers should continue to keep a close eye on Barisan Gold Corp. (BG, TSX-V) which re-started drilling a few weeks ago at its Upper Tengkering Porphyry Prospect in Indonesia…as the company reported January 29, it’s anticipated that hole UTD-005 will intersect the high-grade zone identified at the bottom of UTD-002…the final 59 m of that hole returned 1.2 g/t Au and 0.5% Cu, the highest-grade intercept longer than 50 m drilled at Upper Tengkering so far…this is an interesting discovery and it could heat up again on more drill results, or through fresh speculation in anticipation of results from UTD-005…

Technically, BG has unwound an overbought RSI(14) condition and the Fib. 50% retracement level has held…

Updated Silver Charts

Short-Term Outlook

The $20.50 area was stiff resistance for Silver throughout December and January, and that was finally overcome last week…$20.50 now becomes new support…the next really key area is $21.50 and it’ll be interesting to see if Silver can bust through that resistance this week…importantly, Silver relative to Gold has broken out above a downsloping channel as you can see in this 8-month daily chart – this is bullish for Silver and has positive implications for Gold as we’ve seen in the past…


Long-Term Outlook

If at some point this year Silver can overcome stiff resistance and a downtrend line around $26, watch out – it will likely soar…

Note: John and Jon both hold share positions in GGI, DBV and BG.

February 15, 2014

The Week In Review And A Look Ahead

TSX Venture Exchange and Gold

Note: Canadian and U.S. markets are closed Monday for “Family Day” and “President’s Day”, respectively.

Happy Days are here again.

The “masses” have not likely picked up on this just yet, but it was a hugely significant week for the Venture as the Index finally gave technical confirmation of a critical breakout.  At long last, the bulls have wrestled control from the bears.  Investors who understand this new reality are in a position to potentially make fortunes over the next 6-9 months.

The final nail was driven into the coffin of the Venture bear market this past week when the Index staged a confirmed technical breakout on strong volume through the 970’s.  Charging bulls smashed through this wall of resistance in place for the last 10 months.  Significantly, the 200-day moving average (SMA) has also reversed to the upside, an event that has always been followed by a powerful advance in this market going all the way back to the days when it was known as the Vancouver Stock Exchange.  There are many other technical indicators that confirm a new bull phase is underway, and we’ve reviewed those in recent weeks.  Let’s now take a look at where the Venture could be headed in 2014.

Over the last several months, John’s 3-year weekly Venture chart was our incredibly reliable guide to the end of the bear market and the beginning of this bullish new cycle.  He has now put together a 5-year weekly chart that we’re confident will also serve our readers well as this new bull run unfolds.

As you can see below, the first major resistance on the way up is around 1150.  It’s possible the Index may “flirt” with the 1000 level for a brief period (the 300-day SMA by the way is 1003), or it may immediately surge right through it.  In any event, the next major chart resistance is around 1150, and this is followed by 1350, 1650 and 2000.  The first Fib. target (38.2%), based on the fall from the early 2011 high of 2465, is 1465. This is interesting because that Fib. resistance also corresponds with the Venture’s 1,000-day moving average, certainly a level that realistically could be reached at some point during 2014.

Notice how RSI(14) found support at 50%, previous resistance, and has broken out to its highest level (60%) in three years.  What we’ve also just seen is the first bullish +DI/-DI crossover on the long-term weekly chart since September 2010, and we all know the kind of run the Venture went on after that.


For the week, the Venture was up 34 points to finish at 996 – an impressive 3.5% jump.  The Venture is out-performing the broader equity markets, like it was in 2009 and 2010, and is now 6.9% higher for the year.  That compares to a loss of 2.6% for the Dow, a gain of 1.6% for the Nasdaq and a 3.1% advance for the TSX.  Gold is up 9.5%.

The Importance Of Being Selective

We caution, as always, that a rising tide will not lift all boats.  In this new Venture bull phase, we suspect that how money is going to be deployed (into financings and the open market) will be different than how it was deployed in previous bull markets.  Investors will be more selective – many have learned the hard way from recent mistakes – and the companies that will be favored will be the ones that can demonstrate they have highly competent management and geological teams, and properties of very strong merit.  That means many Venture companies – hundreds literally – won’t fully participate in this upswing.  Continue to avoid “lifestyle” companies like the plague.  They don’t deserve a nickel of your money.

The Sheslay Valley Factor

History has taught us that at times like this, as the junior resource market turns the corner, one of the catalysts is usually one or more important discoveries.  And these discoveries keep providing fresh fuel for the market which is so critical.  An extremely significant situation is unfolding in the Sheslay Valley of northwest B.C., an area we’ve been encouraging investors to look at since June of last year.  Given exploration results to date, plus discussions we’ve had with numerous geologists, prospectors and others, as part of our incredibly extensive months-long research into this very large and previously under-explored region, we’ve come to the conclusion that the Sheslay Valley is underlain by not one, not two, not three, but likely a series of Cu-Au porphyry deposits over a minimum of three properties (the Sheslay, the Hat and the Grizzly) and somewhere at depth could be a high-grade “core”. Further drilling of course will have to prove this out.

Quite simply, at this early stage the Sheslay Valley is showing “all the earmarks” of a world-class Cu-Au porphyry camp, and companies and lives are about to be changed dramatically as a result.  Keep in mind that northwest B.C. is one of the most prospective areas (if not THE most prospective) for large Cu-Au porphyry, Gold, and base metal deposits on the entire planet.  A minimum 600 sq. km area (the Sheslay Valley) in this part of the province has highly encouraging geological, geophysical and geochemical signatures, though overall the Sheslay Valley has been amazingly overlooked and under-explored until now.

Consider this: Every single drill hole (29 altogether) covering a small portion (400 m x 400) of just one target on one property has hit Cu-Au grades that are consistent with those at mines elsewhere in the region, and 9 km to the southeast another company starts drilling on another property and makes an important discovery after just 11 holes.  Yet a third company, preparing to drill its property for the first time ever like the second company, has found “multiple” targets (known mineral occurrences with coincident anomalies) over a 15 km NW/SE trending corridor.  As all of this unfolds, a staking rush ensues.  Then the ears of at least two “majors” start perking up.  Are you beginning to get the picture?  Don’t wait until the “masses” start piling in because they will, and when they do the share prices could go through the roof.  Discovery situations like this are rare and we want our readers to understand how big this could quickly become, and perform their own due diligence, in order to take full advantage of the wealth-building opportunities that we believe exist.

The Sheslay Valley will pour gasoline on the Venture fire.  It is the most exciting and significant exploration story in B.C., and there’s every reason to believe that it will garner national and international attention in the months ahead.

The Seeds Have Been Planted (And Continue To Be Planted) For The Next Big Run In Gold Stocks

There’s no better cure for low prices than low prices.  The great benefit of the collapse in Gold prices in 2013 is that it forced producers (at least most of them) to start to become much more lean in terms of their cost structures. Producers, big and small, have started to make hard decisions in terms of costs, projects, and rationalizing their their overall operations.  Exploration budgets among both producers and juniors have also been cut sharply.  In addition, government policies across much of the globe are making it more difficult (sometimes impossible) for mining companies to put Gold (or other) deposits into production, thanks to the ignorance of many politicians and the impact of radical and vocal environmentalists (technology has made it easier for groups opposing mining projects to organize and disseminate information, even in remote areas around the globe).   Ultimately, all of  these factors are going to create a supply problem – think about it, where are the next major Gold deposits going to come from? On top of that, grades have fallen significantly just over the past decade.

It doesn’t take a rocket scientist to figure out that the next huge bull market in Gold stocks is just around the corner due to demand-supply dynamics, much leaner producers who will suddenly become earnings machines, and a junior market that will be healthier simply because a lot of the “lifestyle” companies sucking money out of investors will simply disappear or get taken over by individuals or groups who are actually competent and serious about building shareholder value.   A healthy “cleansing” in the market has been taking place.  As this continues, more and more seeds are being planted for an incredible future move in well-managed Gold producers and explorers that could make the dotcom bubble look like a tea party.  As for the juniors, focus on the small universe of companies that have the ability to execute both on the ground and in the market.  Companies that are strong financially, have superior exploration prospects, competent management and clean share structures.

Gold

The breakout in the Venture confirms to us that Gold indeed hit bottom last year just below $1,200 an ounce.  Goldman Sachs and others who are waiting for Gold to hit $1,000 an ounce – well, their wait may be longer than the one Toronto Maple Leaf fans are still suffering through for the Stanley Cup.

Gold, like the Venture, had a powerful week, busting through important resistance at $1,275 and closing at $1,319, a gain of $52 from the previous Friday.  Chinese demand is robust, short-covering is occurring, and the U.S. Dollar Index is weak with a test of critical support at 79 on the horizon.  So Gold bulls have regained the upper hand.  Gold should move even higher from here to test resistance at $1,350.  It may then consolidate its gains (perhaps even test new support at $1,275) before zooming higher again.

Holdings in SPDR Gold Shares (GLD), the world’s largest Gold ETF, rose by 7.5 metric tons Thursday to 806.35, according to the ETF’s website.  They are now up by 15.89 tons since Jan. 28 after a large decline in 2013.

Below is a 9-month daily Gold chart from John.  Note the double bottom reversal pattern.  Gold is now above its 200-day SMA for the first time in a year.


Silver soared $1.51 an ounce last week to close at $21.51.  Copper finished unchanged at $3.26.  Crude Oil climbed 42 cents to $100.30 while the U.S. Dollar Index slid another half a point to 80.15.

The “Big Picture” View Of Gold

As Frank Holmes so effectively illustrates at www.usfunds.com, the long-term bull market in Gold has been driven by both the Fear Trade and the Love Trade.  The transfer of wealth from west to east, and the accumulation of wealth particularly in China and India, has had a huge impact on bullion.  Despite Gold’s largest annual drop in three decades in 2013, the fundamental long-term case for the metal remains solidly intact – currency instability and an overall lack of confidence in fiat currencies, governments and world leaders in general, an environment of historically low interest rates, a Fed balance sheet now at $4 trillion and still expanding, money supply growth around the globe, massive government debt from the United States to Europe, central bank buying, flat mine supply, physical demand (especially from China), emerging market growth, geopolitical unrest and conflicts…the list goes on.  However, deflationary concerns around the globe and the prospect of Fed tapering had a lot to do with Gold’s plunge during the spring below the technically and psychologically important $1,500 level, along with the strong performance of equities which drew “momentum traders” away from bullion.  June’s low of $1,179 was likely the bottom for Gold.  Extreme levels of bearishness emerged in the metal last year.  With the long-term bull market remaining intact, we expect new all-time highs in Gold as the decade progresses.  Inflationary pressures should eventually kick in around the globe after years of ultra-loose monetary policy.

Independent Research and Analysis of Gold, Silver, Copper, the TSX Venture Exchange and Emerging Junior Resource Companies: Speculative Opportunities in Today’s Markets

Welcome to our site, or at least the initial version of it!  BMR has been online for more than four years and strictly through word-of-mouth we have built a loyal following.  We encourage reader feedback and the exchange of helpful opinions and ideas among investors in our forum. 

We’re continuing with our plans to ultimately construct a very unique investment and money-management resource site that goes considerably beyond what we have now.  We focus a great deal on the Gold, Silver and Copper markets as well as trends in the global economy, in addition of course to the technical health of the TSX Venture Exchange (CDNX).  An important component of this site, as well, will always be original research on high quality junior exploration companies or small producers that offer very real and significant upside potential. We are extremely selective in the companies we feature and put forward to investors – we prefer quality over quantity, and we are being more selective than ever in the current market environment.  We look for companies with the ability to execute both on the ground and in the market, who are determined to build shareholder value, which actually excludes most Venture stocks.  However, investors must understand that the companies we do put forward for our readers’ due diligence are still highly speculative situations and entail considerable risk, volatility and unpredictability.

Our intent is to provide you with information that you can use as part of your own due diligence.  Our stock coverage is for informational and entertainment purposes only and must not be viewed or interpreted as “buy”, “sell” or “hold” recommendations. We are not Registered Securities Advisers. Our opinions can only be construed as a solicitation to buy and sell securities when they are subject to the prior approval and endorsement of a Registered Securities Adviser operating in accordance with the appropriate regulations in your area of jurisdiction. Always perform your own due diligence and please read our disclaimer at the bottom.

We use a combination of fundamental and technical factors in determining the value and potential of a stock.  In terms of fundamentals we look for a company with a superb project supported by strong management.  Management must possess integrity, solid ethics and a determination to succeed and build shareholder value.

At BullMarketRun (BMR) we approach the handling of money from a biblical perspective and this is an important topic we will be sharing with our readers (and listeners) as the site continues to develop. The Bible teaches so much about money and how to handle it and invest it –  there are literally thousands of verses on how we should handle the money and possessions that God entrusts us with.  By examining the life of Jesus and reading the Word of God, we can all become fully equipped to be successful investors and handle money wisely.  We have a God who thinks big – He created the universe – and He wants us to think big  in every area of our lives.  When we handle money from a Biblical perspective (His money that we have been given stewardship of), He will bless you.  This all begins, of course, with a personal relationship with Jesus Christ by accepting Him as your Lord and Savior and putting Him at the throne of your life.  It is the most important decision you’ll ever make.

God Bless,

Terry Dyer

Owner/Publisher, www.BullMarketRun.com

Disclaimer:

BullMarketRun.com (BMR) is completely independent from any companies it covers.  BMR accepts no compensation of any kind from any groups, individuals or corporations for coverage of any company mentioned on this site.  We accept no advertising either.  Our stock coverage is for informational and entertainment purposes only and must not be viewed or interpreted as “buy”, “sell” or “hold” recommendations. No investment opinion or other advice is being rendered on any stock or company. We strongly recommend that you consult with a qualified investment adviser, one licensed by appropriate regulatory agencies in your legal jurisdiction, and do your own due diligence and research before making any investment decisions. The stocks we cover, by definition, are highly speculative and potentially very volatile. Investors are cautioned that they may lose all or a portion of their investment if they make a purchase or short sale in these speculative stocks.  We are not Registered Securities Advisers. Our opinions can only be construed as a solicitation to buy and sell securities when they are subject to the prior approval and endorsement of a Registered Securities Adviser operating in accordance with the appropriate regulations in your area of jurisdiction. It should be assumed that BMR personnel, writers and their associates may hold or dispose of or trade in positions in any securities mentioned herein at any time.  Owner/Publisher of BullMarketRun.com is Terry Dyer of Langley, British Columbia.

Forward Looking Statements:

All statements in BMR’s reports, other than statements of historical fact, may be forward-looking statements. These statements relate to future events or future performance. Forward-looking statements are often but not always identified by the use of words such as “seek”, “anticipate”, “plan”, “continue”, “estimate”, “expect”, “may”, “will”, “project”, “predict”, “potential”, “targeting”, “intend”, “could”, “might”, “should”, “believe” and similar expressions. These statements involve known and unknown risks, uncertainties and other factors that may cause actual results or events to differ materially from those anticipated in such forward-looking statements.

February 14, 2014

BMR Morning Market Musings…

Gold broke above its 200-day moving average (SMA) at $1,304 for the first time in more than a year overnight…as of 6:40 am Pacific, bullion is up $15 an ounce at $1,318…Silver has cleared resistance at $20.50…it’s up 75 cents at $21.24…Copper is 2 cents higher at $3.26…Crude Oil is off 64 cents to $99.72 while the U.S. Dollar Index is down one-tenth of a point to 80.20…

According to Tom Fitzpatrick, an analyst at Citigroup’s technical research unit, CitiFX, Gold could get a pick-me-up from a “bullish double bottom between June and December last year,” Reuters reported. “We fully expect that Gold has the potential to once again test the neckline of a double bottom which stands at $1,434 an ounce,” Fitzpatrick said.

Several factors have been helping Gold recently including continued strong demand out of China, bullish technical signals and some short-covering…meanwhile, recent U.S. economic data, including disappointing jobs growth, has hurt the greenback which in turn is also boosting Gold’s appeal…technically, the U.S. Dollar Index appears poised to test critical support at 79…comments from newly instated Federal Reserve Chair Janet Yellen indicate that the Fed will continue its accommodative monetary policy…the Gold price had already “baked in” the start of tapering before it was announced December 18…

Today’s Markets

Asia

China’s benchmark Shanghai Composite rebounded to approach Tuesday’s one-month high of 2122 after breaking its five-day winning streak yesterday…the Index closed 17 points higher overnight to finish the week at 2116…China’s consumer inflation rate held steady at 2.5% in January as beef and vegetable prices rose, China’s National Bureau of Statistics reported today…it was slightly above projections of a 2.3% rise in separate surveys from The WSJ and Reuters…producer prices, however, fell for the 23rd straight month…Japan’s Nikkei average bucked the trend in Asia, slipping 222 points or 1.5% to close at 14313…

Europe

European markets are mostly modestly higher in late trading overseas…data released just a short while ago showed the euro zone economy grew faster than expected in the fourth quarter of 2013…official figures published by Europe’s statistics agency, Eurostat, revealed the economy had expanded by 0.3% over the period compared with the previous quarter, above analyst forecasts of 0.2%…earlier today it was reported that Germany and France, Europe’s two biggest economies, posted better than expected growth in the fourth quarter, reinforcing hopes of a steady post-crisis recovery in the euro zone…

North Ameria

The Dow is down 21 points as of 6:40 am Pacific…the TSX is 29 points higher while the Venture has added 5 points to 991, about a dozen points below its 300-day moving average (SMA)…

Venture Confirmed Breakout

After numerous attempts going back to the second quarter of last year, the Venture has finally staged a confirmed breakout above stiff resistance in the 970’s which obviously now becomes rock-solid support…below is a 6-month daily chart from John that shows how the recent 5% correction was a healthy pullback, unwinding an overbought RSI(14) condition and laying the foundation for a strong move on higher volume through this critical resistance…

In a detailed Week In Review tomorrow, we’ll take a look at just how high the Venture could climb in 2014…the Index’s 200-day moving average (SMA) is now reversing to the upside, so wave goodbye to a vicious bear market that wiped 65% off the value of the Venture between early March 2011 and late June 2013…this reversal started in October last year when the Index, as we noted at the time, broke above a long-term downtrend line…interestingly, a month earlier, the U.S. Dollar Index fell below a long-term uptrend line…

CDNX 6-Month Daily Chart

CRB Index Updated Chart

The breakout in the Venture coincides with bullish technical behavior in the CRB Index which held critical support and has now broken above a downtrend line…check out this 20-year monthly chart from John…clearly, there is increasing up momentum in the CRB Index and that’s powerful supporting evidence for the start of a fresh bullish phase for the Venture

Probe Mines Ltd. (PRB, TSX-V)

Probe Mines Ltd. (PRB, TSX-V) has had a great week, surging to a new all-time high after more outstanding drill results from its multi-million ounce Borden Lake Gold Project in northern Ontario…this has been one of the best exploration stories in the country over the last year, but many investors missed it simply because they weren’t paying attention…fortunes are born during bear markets when the masses walk away…

Below is an updated 2.5-year weekly PRB chart – the next measured resistance is around $4.25 after yesterday’s strong push through the $3 level…


More Activity In The Sheslay Valley

Alix Resources Corp. (AIX, TSX-V) announced this morning that it has more than doubled its land position in the Sheslay Valley, acquiring claims east of and contiguous to Teck Resources’ (TCK.B, TSX) 600 sq. km Eagle Project which adjoins the southern boundary of Garibaldi Resources’ (GGI, TSX-V) Grizzly Project…Alix now controls nearly 50 sq. km in the Sheslay region, putting it fifth in total holdings among juniors behind Garibaldi, Prosper Gold Corp. (PGX, TSX-V), Romios Gold Resources Inc. (RG, TSX-V) and, of course, Doubleview Capital Corp. (DBV, TSX-V) which recently announced a drilling discovery at its Hat Property…Sheslay Valley claim values are obviously going way up in price – terms of the deal for the Halt Property that Alix acquired from an arm’s-length vendor are $200,000 and two million shares over three years for a 100% interest, less a 1% NSR that can be purchased at the company’s option for $1 million…we’ll have more on the Sheslay Valley situation over the weekend…

High North Resources Ltd. (HN, TSX-V)

Quality energy plays on the Venture have been hot, and one excellent example is High North Resources Ltd. (HN, TSX-V) which has doubled in the last month…the company has started to receive revenue from its two Montney horizontal wells which were flowing with combined preliminary rates exceeding 350 barrels of oil per day over a seven-day period as reported by HN February 5…

Below is a 14-month weekly HN chart…High North has broken out after consolidating within a horizontal flag…it’s up 3 cents at 63 cents after the first 10 minutes of trading…as always, perform your own due diligence…

Canada Carbon Inc. (CCB, TSX-V) Updated Chart

Note: John and Jon both hold share positions in GGI and DBV.  Jon also holds a share position in PGX.

February 13, 2014

BMR Morning Market Musings…

Gold has hovered between $1,286 and $1,299 so far today…as of 7:50 am Pacific, bullion is up $5 an ounce at $1,297…Silver is up a dime to $20.34…Copper is down 2 pennies at $3.24…Crude Oil is down slightly, just above $100 a barrel, while the U.S. Dollar Index has fallen one-third of a point to 80.34…this is a slightly delayed and abbreviated edition of Morning Musings due to Telus wireless issues in parts of Vancouver this morning…

Concerns about high debt and an overvalued currency are sucking Gold imports into China, according to a new report from Lombard Street Research…it adds that China may indeed be moving in the direction of using Gold in a plan to make the yuan an international currency…Beijing has said that it does not view Gold as a useful asset for diversifying the country’s $3.8 trillion worth of foreign exchange reserves, according to media reports…China’s official reserves of Gold stand at 1,054 metric tons, worth about $45 billion (U.S.)…this figure has not been updated since 2009 and Lombard believes that since then, with China’s imports of Gold and domestic production totaling 4,500 metric tons, the country’s Gold reserves have increased significantly…

CIBC believes 2014 will a much better year for junior Gold mining companies as Gold prices stabilize and investor confidence returns to the marketplace…CIBC said in a research note that with a challenging 2013 now in the past, 2014 will be a year of “multiple expansion” for junior miners…“We expect a more constructive Gold price and diminished cost inflation for miners should lead to investors ascribing greater option value to underlying assets in the junior space,” CIBC said. “With commodity prices and costs starting to move in the right direction, we believe investors can look to developers for Gold exposure given where the multiples sit.” CIBC said their focus is on well capitalized companies with high-grade deposits and/or infrastructure-supported projects.  “We suspect such assets will be more attractive from a financing perspective and as potential acquisition targets in the near term,” they stated…

Gold Breakout – Updated Chart

Gold has staged a confirmed breakout above chart resistance around $1,275 and a downtrend line as shown in this updated 9-month daily chart…RSI(14), at 65%, still has room to move higher – we’ll see if it encounters resistance at 70% as it did last summer…Gold’s next major resistance is $1,350…


Platinum Long-Term Chart

Supply-demand factors have many analysts bullish on Platinum this year…below is a 20-year monthly “big picture” technical view of the metal…sell pressure has been dominant since late 2011 but Platinum has exceptional support at $1,300 while RSI(14) has been able to hold at or above the 40% level for an extended period…

One of our favorite companies in the Platinum space is Platinum Group Metals Ltd. (PTM, TSX) which closed a bought deal financing for $175 million at $1.18 per share at the end of last year as it pushes ahead with mine development at the Waterberg JV Project in South Africa and continued exploration at the Waterberg Extension which is showing considerable promise…

Today’s Markets

Asia

Japan’s Nikkei average tumbled 265 points or 1.79% overnight to 14535…after four straight winning sessions that took the Index to a one-month high, China’s Shanghai Composite slid 12 points to close at 2098…

Europe

European shares are down moderately in late trading overseas…

North America

The Dow is off 27 points as of 7:30 am Pacific, thanks in part to some weaker than expected economic data…U.S. retail sales declined 0.4% in January from December as reported by the Commerce Department this morning…excluding autos, retail sales were flat…revisions showed that retail sales fell 0.1% in December, down from an initially reported 0.2% rise…economists surveyed by Dow Jones Newswires had forecast a 0.1% drop in overall retail sales in January and a 0.1% rise in sales excluding autos..meanwhile, initial claims for state unemployment benefits rose to a seasonally adjusted 339,000 from 331,000 the week before, the Labor Department said this morning…the four-week moving average for new claims rose slightly to 336,750 from 333,250…

Federal Reserve Chair Janet Yellen’s appearance today before the Senate Banking Committee has been postponed by expected inclement weather in the Washington D.C. area…the new Fed chief appeared Tuesday before the House Financial Services Committee for semi-annual testimony on the economy and monetary policy…she largely signaled continuity in the Fed’s policy…

The TSX has reversed earlier losses and is now up 6 points as of 7:50 am Pacific…the Gold Index is 3 points higher at 192 as investors shrug off earnings reports that included more “impairment charges” from the likes of Barrick Gold Corp. (ABX, TSX), Goldcorp Inc. (G, TSX) and others…

In a news release this morning, Barrick President and CEO Jamie Sokalsky stated, “Under a comprehensive plan to strengthen the company, we have become a leaner, more agile organization, better protected against further downside price risk and well positioned to take advantage of attractive investment opportunities going forward. We have increased our focus on free cash flow and risk-adjusted returns, and successfully executed on our key priorities, which include operational excellence, a stronger balance sheet and the ongoing optimization of our asset portfolio. This required decisive action, including the temporary suspension of Pascua-Lama, and an even greater focus on generating higher returns even if that means producing fewer ounces. These were the right decisions for our shareholders and for the company, and we are now seeing the tangible benefits of our efforts.”

TSX Updated Chart

A four-year weekly TSX chart from John shows a market climbing a steady uptrend and on the verge of pushing through resistance around current levels…it appears from this chart that the TSX will take a run at its early 2011 high just above 14300…the TSX has recouped nearly all of its losses from the 2011 correction, while the Venture is still off 60% from its high of 2465…


Starcore International Mines Ltd. (SAM, TSX) Updated Chart

Rising Gold prices and a weak Canadian dollar will help producers including Starcore International Mines (SAM, TSX) which recently reported its best annual production (24,425 AuEq ounces, a 27% increase over the previous calendar year) since 2007…Starcore is now aiming to expand resources at its St. Martin mine with a 5,000 metre drill program this year…technically, 24 cents remains key resistance for SAM as shown in this 2.5-year weekly chart…strong support exists at 20 cents…encouragingly, the 200-day moving average (SMA), at 19 cents, is now reversing to the upside – ending a decline that started in late 2012…overall trend is clearly bullish…

Venture Update

A confirmed breakout has yet to occur in the Venture as it continues its attempt to make a decisive move through the 970’s…we believe it’s just a question of when, not if, so investors must remain patient…the Index is looking very strong, as John’s chart showed yesterday, so investors should have confidence embracing this morning’s minor weakness…a strong close to the week tomorrow, and a confirmed breakout, could definitely be in the cards…

Contact Exploration Inc. (CEX, TSX-V) Updated Chart

Energy plays have been in the spotlight this week, and one company we strongly suggest our readers perform their due diligence on is Contact Exploration Inc. (CEX, TSX) which continues to have fundamentals and technicals in its favor…this is a textbook chart (2.5-year weekly)…after testing uptrend support, CEX is poised to move higher…


Global Met Coal Corp.(GMZ, TSX-V)

Recent news from Global Met Coal Corp. (GMZ, TSX-V) was very positive, as we indicated, and GMZ closed above resistance yesterday at 5.5 cents…this was a breakout that requires confirmation…GMZ is unchanged at 5.5 cents as of 7:50 am Pacific

Note: Jon holds a share position in GMZ.

« Newer PostsOlder Posts »
  • All Posts: