The curious action in the CDNX recently tipped us off to a possible major move in the price of gold and there is a growing mountain of evidence to support that view.
Commercial short positions in gold have dropped to their lowest levels since September before the big rally of last fall began – it is foolhardy to bet against the commercial traders who are notoriously correct. The commercials have also taken an extraordinarily high long position in the beaten down Euro, suggesting the U.S. dollar may have topped out for the time being at least.
Rising overall commodity prices, including impressive strength in crude oil, suggests the world economy is picking up steam and inflationary forces are gaining momentum. The very strong Canadian dollar, a commodity driven currency, is clear evidence for that (what this means for interest rates could be a potential problem down the road for the markets).
Technically, gold’s 14-day and 30-day moving averages have swung positive, and the 60-day SMA is very close to turning positive which would be a major development.
Below we have an interesting chart and comments from John in Peterborough, Ontario (BMR’s contributing techncial analyst), who’s not quite ready to say the party’s on – but he’s getting very close. Thanks, John!

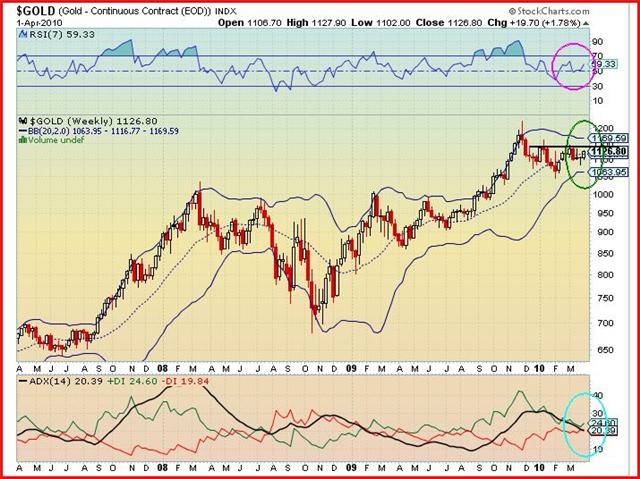
John: Starting this coming week we are going to see GOLD assault the $1,140 resistance. Not only must it get through this level but close above it for a minimum of 2 consecutive days. This effectively would change $1,140 from resistance to support. The $1,140 level is shown as a black horizontal line on the chart.
The top indicator is the RSI, a momentum indicator, and it shows a small “W” formation and is pointing up – very bullish (mauve circle).
On the chart the Bollinger bands which are close together and horizontal are a strong indicator of near term future volatility (green circle).
The indicator below the chart is a trend indicator – ADX (black line) is low, showing the trend is weak because GOLD has been in a 4-month consolidation.
The green Directional Indicator (up) line (+DI) is above the red Directional Indicator (down) line (-DI) – very bullish (light blue circle).
Remember, the ADX line shows the strength of the trend and NOT the direction. The position of the +DI and the -DI indicates the direction.
