TSX Venture Exchange and Gold
This is our final abbreviated posting due to the holidays. Regular postings resume tomorrow.
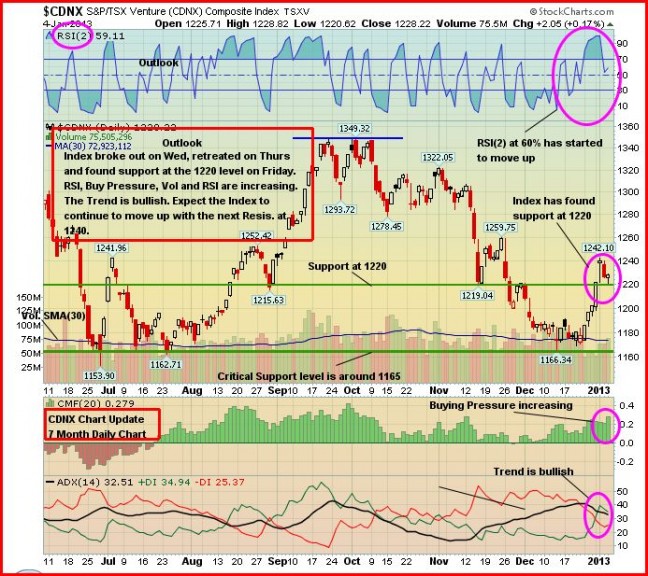
The Venture Exchange had another good week, though on relatively light volume due to the holidays. The Index climbed 26 points to close at 1228, just a few points below its still-declining 50-day moving average (SMA). The 20-day (SMA) has reversed to the upside after being in decline since mid-October. As we have pointed out repeatedly, the fact that the Venture could not be driven to a new 52-week low in December despite the pressures of tax loss selling, weakness in Gold, and the ridiculous “fiscal cliff” hysteria whipped up by an ignorant mainstream media, is extremely bullish. The low from last June (1154) was successfully tested in a double bottom pattern, so the psychology of this market could soon change rather dramatically with the belief that 1154 was indeed the low of the bear market that commenced in early March, 2011. The drop was 53%.
Regular readers will know that we have charted quite a few similarities in recent years between the Venture Exchange and China’s Shanghai Composite Index. Their trading patterns have been quite similar, strangely enough. One reason could be that they are both speculative markets. Late last month, the Shanghai finally broke out from a down trendline that had been in place since early 2011. The Venture is currently very close to breaking out of its down trendline (around 1240). The Shanghai has typically moved first on trend changes, slightly ahead of the Venture, so we do expect the Venture to soon bust loose if this pattern continues and we have every reason to believe it will.
Below is an updated 7-month daily Venture chart from John. RSI(2) has recently unwound an overbought condition. Previous resistance at 1220 now appears to have become support. Near-term minor resistance is at 1240. The Index has some serious heavy lifting to do, however, to power through a resistance area between 1260 and 1275. The energy required to do so should come from breaking out above the down trendline. Investor patience is required. We’re certain the “big picture” trend has changed given the fourth quarter reversal to the upside in the long-term 1,000-day SMA. That was a significant technical event. 2013 for the Venture will have its ups and downs but overall it should be a much better year than 2012, just based on the technical picture.
Gold
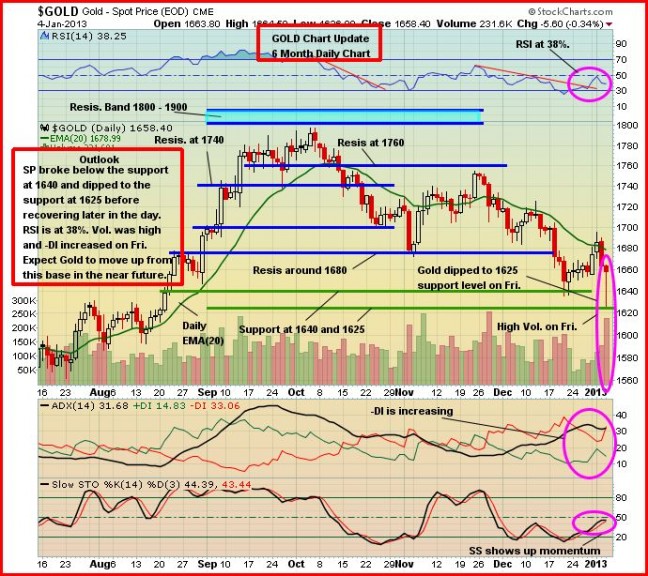
Gold ended up relatively unchanged for the week, closing at $1,657, despite plummeting Thursday and early Friday after release of December’s Fed minutes that showed some surprising dissension within the Federal Reserve as to how long QE3 should continue. As we commented Friday morning, traders likely over-reacted to the Fed minutes, which has occurred in the past. Gold dropped briefly into the $1,620’s before rallying strongly and finishing above important support at $1,640 (very bullish). Friday’s employment report from the Labor Department shows the U.S. economy still has a long way to go before unemployment can fall to the Fed’s target level of 6.5%. And doves including Chairman Ben Bernanke also still remain in the driver’s seat of Fed policy. The ever-expanding Fed balance sheet ($85 billion per month currently after December’s fresh stimulus) is of concern to some Fed members, though, and so it should be. They worry that, among other things, the Fed’s large and growing balance sheet could make it hard to tighten credit down the road if inflation heats up. There are many factors driving Gold and we just don’t see the Fed acting hastily to end QE3 before the end of 2013.
Below is an updated 6-month daily Gold chart from John. Note how Gold recently broke above an RSI(14) down trendline. This is usually a good sign.
Silver closed 15 cents higher for the week at $30.18. Copper was strong, adding 8 cents to $3.64 on positive economic news out of China. Crude Oil gained $2.29 a barrel to $93.09 while the U.S. Dollar Index jumped nearly a full point to 80.51. Tomorrow morning, John will have his usual short-term and long-term Silver charts.
The “Big Picture” View Of Gold
As Frank Holmes so effectively illustrates at www.usfunds.com, Gold is being driven by both the Fear Trade and the Love Trade. The transfer of wealth from west to east, and the accumulation of wealth particularly in China and India, is having a huge impact on Gold.
The fundamental case for Gold remains incredibly strong – currency instability and an overall lack of confidence in fiat currencies, governments and world leaders in general, an environment of historically low interest rates and negative real interest rates that won’t end anytime soon (inflation is greater than the nominal interest rate even in parts of the world where rates are increasing), money supply growth, massive government debt from the United States to Europe, central bank buying, flat mine supply, physical demand, investment demand, emerging market growth, geopolitical unrest and conflicts, and inflation concerns…the list goes on. QE3 has arrived, and massive central bank intervention is now taking place to prevent a breakup of the euro zone and to kick-start the global economy. It’s hard to imagine Gold not performing well in this environment.


