Gold has moved sharply higher after the Commerce Department reported at 5:30 am Pacific that the U.S. economy actually shrank unexpectedly during the fourth quarter…as of 6:50 am Pacific, the yellow metal is up $13 an ounce at $1,677…Silver quickly reversed its losses and is now up 44 cents at $31.82…Copper has held its gains and is up a nickel at $3.71…Crude Oil is 16 cents higher at $97.73 while the U.S. Dollar Index has fallen one-fifth of a point to 79.37…
U.S. GDP Shrinks In Q4
U.S. gross domestic product dropped at a 0.1% annual rate, the worst performance since the second quarter of 2009, when the world’s largest economy was still in the recession, Commerce Department data showed this morning…that’s a sharp slowdown from the 3.1% rate in the July-September quarter…the median forecast of 83 economists surveyed by Bloomberg called for a 1.1% gain in GDP during Q4…the Federal Reserve is wrapping up its 2-day meeting and will be making a policy statement later today…the U.S. economy was hurt in the fourth quarter by the biggest cut in defense spending in 40 years, fewer exports and sluggish growth in company stockpiles…
Today’s Markets
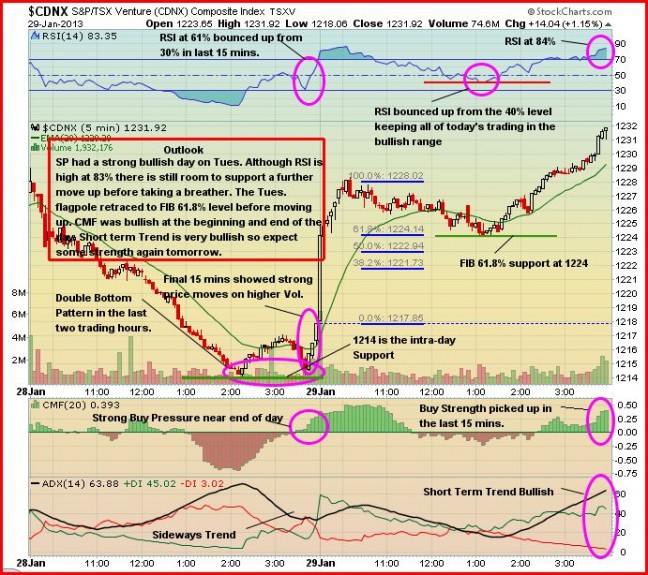
Global stocks are flirting with their best levels in more than four-and-a-half years – with some national benchmarks approaching all-time highs – as investors become more optimistic about the world’s economic prospects and thus corporate earnings…the laggard, of course, has been the Venture Exchange but we do expect it to start playing “catch up” as this first quarter progresses…CDNX momentum should pick up once the Index is able to push through the 1240 area which has provided stiff resistance since the beginning of the year…this would also trigger a reversal to the upside in the 50-day moving average (SMA) which has recently flattened out and is now providing support near this week’s low of 1214…below is another 2-day chart from John that shows the short-term trend is indeed very bullish after Monday’s intra-day recovery and yesterday’s 14-point gain to 1231…this sets up the strong possibility of a month-end breakout – finally – through 1240…
Venture-Gold-Copper Comparative Chart
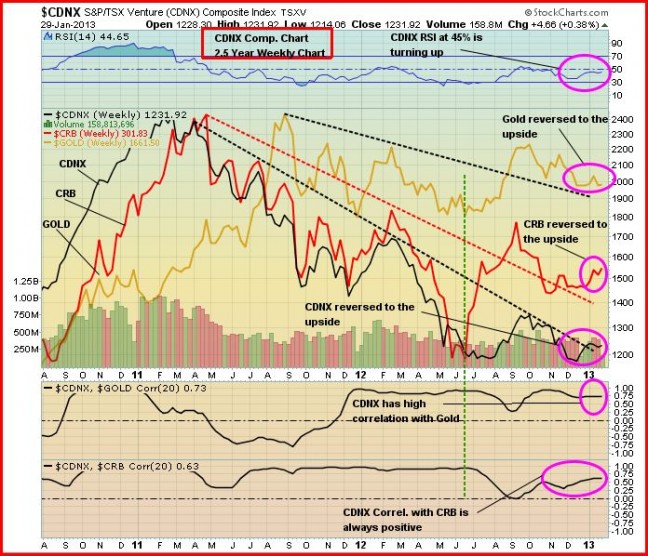
This CDNX–Gold-CRB 2.5-year comparative chart comp shows how the Venture (in black) has broken above a down trendline in place since early 2011…this is fresh evidence that a breakout to the upside is likely in the very near future…
As of 7:00 am Pacific, the Venture is up 4 points at 1236…the TSX has climbed 56 points while the Dow has swung positive with an 8-point gain…
Aurcana Corp. (AUN, TSX-V) Chart Update
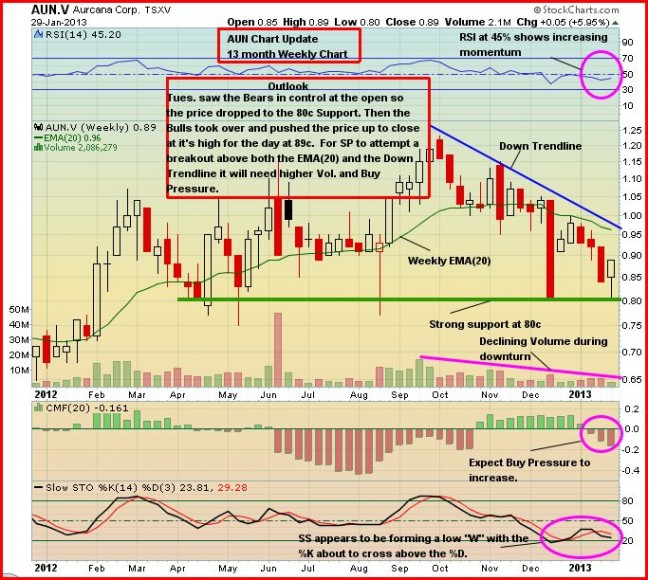
Aurcana (AUN, TSX-V) is bouncing back after finding support once again in the 80-cent area this week, just like it did in May, August, and December of last year…below is a 13-month weekly chart from John…not surprisingly, this Silver producer typically responds very well when the metal is in an uptrend…as of 7:00 am Pacific, AUN is up 2 pennies at 91 cents…
2012 U.S. Mineral Production Statistics
The U.S. Geological Survey released some interesting mineral production statistics yesterday…last year, 11 states each produced more than $2 billion worth of non-fuel mineral commodities including (in descending order of value) Nevada, Arizona, Minnesota, Florida, California, Alaska, Utah, Texas, Missouri, Michigan and Wyoming…the mineral production of these states accounted for 64% of the total U.S. output value, said the report…number-one ranked mining state Nevada’s principal mineral production, in descending order of value, included Gold, Copper, Silver, lime, sand and construction gravel for a total combined value of $11.2 billion in 2012…second-ranked Arizona contributed total mineral production worth $8.05 billion including (in descending order of value) copper, molybdenum, sand and gravel, cement and Silver, while third place Minnesota reported $4.5 billion of combined mineral production including (in descending order of value) iron ore, sand and gravel for both construction and industrial, crushed stone and dimension stone…U.S. mine production of copper in 2012 increased by 4% to 1.15 million tons and was valued at $9 billion…Arizona, Utah, New Mexico, Nevada and Montana – in descending order of production – accounted for more than 99% of domestic mine copper production…thirty operations yielded more than 99% of the Gold produced in the U.S. in 2012 with total Gold mine production valued at $12.6 billion…U.S. mines produced 230 metric tons of gold in 2012, down from 234 metric tons in 2011…in 2012, the United States mined 1,050 tons of Silver with an estimated value of $1.01 billion, down from 1,120 tons in 2011…Alaska was the country’s leading silver-producing state, followed by Nevada…Silver was produced as a byproduct from 35 domestic base and precious-metals mines…
Note: John, Jon and Terry do not hold positions in AUN.


5 Comments
@bmr; If the fed announces today that they will continue with their QE policy (and most suspect they will) do you think silver will break above its stiff resistance at 32.50?
Ventures gaining steam!!! About to boil over I think.
RBW, another on line chat sheduled for to-morrow. I predict that it will go thru the presidents up date released earier this week. To quote that little old lady in the tv add, a number of years ago, WHERE IS THE MEAT? enough said. richard l
Another live presentation by RBW Thursday Jan 31st. When are they actually going to release real results?
great news release moments ago on v.ole. Should be a good run and fast buyout!! glta