Gold is firmer today with physical demand giving the market a lift out of temporarily oversold conditions…as of 7:20 am Pacific, bullion is off its highs of the day but still up $10 ounce at $1,402…Silver is a nickel higher at $23.33…Copper is off 8 cents at $3.12…Crude Oil has gained 47 cents to $88.20 while the U.S. Dollar Index is down more than one-tenth of a point at 82.42…
The World Gold Council came out swinging yesterday with a strong statement:
“It has become increasingly clear over the course of the past week that the fall in the Gold price was triggered by speculative traders operating in the futures markets…their short-term view of generating a trading profit is in stark contrast to the views of long-term investors in Gold, as evidenced by the massive wave of physical Gold buying that began over the weekend and accelerated following Monday’s further decline…the surge in Gold purchases is spanning markets from India and China to the U.S., Japan and Europe…buyers are viewing this as an opportunity to purchase Gold at prices not seen in the past couple of years.
“The World Gold Council is uniquely positioned in the Gold market to get immediate feedback on market patterns…we are already seeing shortages for bars and coins in Dubai, while premiums in Mumbai are at $26/oz and $6 in Shanghai, indicating that buyers are willing to pay more than current spot prices for the metal.
“Clearly the desire to own Gold, as an investment and for adornment, has made itself felt in the physical market…Gold operates on the basic economic fundamentals of demand and supply…our view is that demand is strong while supply remains constrained, and that this dynamic ultimately drives the long-term price of the metal”…
“It’s Just Like The Sales After Christmas”
“It’s just like the sales after Christmas”, said Nigel Moffatt, treasurer at Perth Mint, in a Reuters story this morning…the Perth Mint, which opened in 1899 in response to the discovery of rich Gold deposits in Coolgardie and Kalgoorlie, refines between 300 and 400 tonnes of precious metals each year at what it says is the largest facility in the southern hemisphere…”Anything you could buy $200 cheaper today than you could last week becomes fairly tempting”, Moffatt added…”It’s surprising how such enormous liquidation brings such enormous interest at the other end from small investors…what we keep in terms of retail stocks, yes, they are being depleted fairly quickly…as usual, it appears that China is leading the charge”…
Updated Gold Chart
The big question is, has Gold put in a true bottom yet or are we just seeing a rally out of the very oversold conditions that emerged earlier this week?…we continue to remain very cautious given what the long-term chart is telling us after bullion broke critical support levels at $1,550 and $1,500…deflationary forces in the global economy are strengthening, so we disagree with the World Gold Council when it states that the recent plunge in the Gold price was merely the result of actions by speculative, short-term thinking traders…that’s what Gold bugs would like to hear (we continue to be “Gold bugs” as we believe bullion and Gold stocks have great value for the long-term), but something more fundamental is afoot at the moment and we’ll explore that angle in more detail next week…
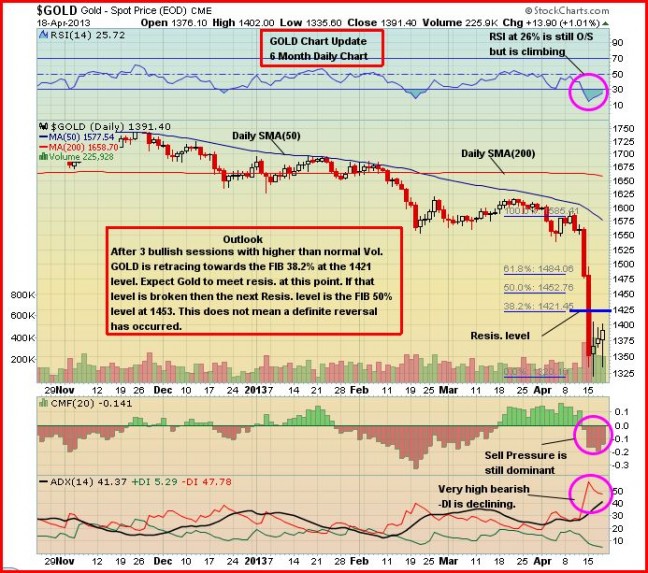
Below is a 6-month daily chart for Gold which shows Fibonacci resistance levels at $1,421, $1,453 and $1,484…any near-term rallies are going to be very hard-pressed to climb above $1,484, for sure – it will take massive heavy-lifting to overcome attacks from the shorts immediately below $1,500, and for that matter throughout the $1,400’s…perception is reality, and right now the reality in the minds of many traders is that the bull market in Gold is over…
Copper & Oil – Also Gearing Up For Big Downside Moves?
Yesterday, we posted a Copper chart from John which was decidedly bearish…we’re just the messenger calling it like it is…we’d rather see Copper zoom higher but the reality is, there are significant risks to the downside in this metal at the moment and that’s not a good sign for the global economy or markets in general…at the very least, expect Copper to strongly test a support band between $2.60 and $3.00…
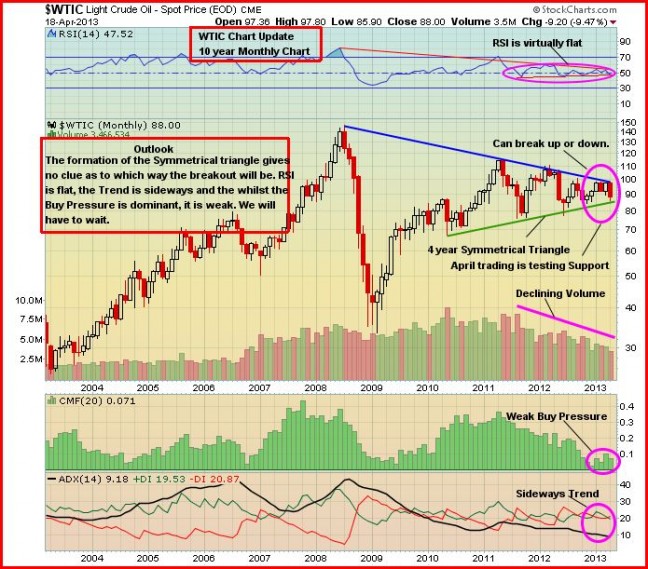
Our other concern is Crude Oil…below is a very interesting 10-year monthly WTIC chart…”decision time” for Crude is drawing near given the symmetrical triangle formation…will Crude break to the upside, or the downside?…it’s impossible to say based on this chart…fundamentally, however, markets go up or down based on supply and demand…a significant amount of new supply is coming into the Oil market (notably from the United States which in five years may not have to import Oil from any country other than Canada) and if you accept the premise that growth in the global economy may disappoint this year, then you have a good case that WTIC will likely break to the downside (lower Oil prices, however, would ultimately help spur economic growth and would also be positive for Gold stocks)…
TD Securities: Market Balances For Some Industrial Commodities Tilted Toward Oversupply For Now
“Even the previously uber bullish U.S. equity market is starting to signal economic trouble ahead”, according to TD Securities…muted demand outlook means the market balances for a number of industrial commodities likely will remain tilted toward oversupply for now, TDS says…”A poor demand outlook in the coming months also had a negative impact on platinum and palladium, metals which are likely to have long-term structural deficits”, TDS believes…”The PGM’s group should have a speedier recovery when the demand conditions do eventually improve, but there will be a short-term price to pay nonetheless…in addition, the growing likelihood that supply will grow at a faster pace than demand for industrial commodities like copper, aluminum and Oil have contributed to the industrial commodity slide of late…the fundamental change in the long-term supply/demand balance expectation has been the greatest for Copper, which has moved from a deficit to a surplus outlook…this suggests that Copper should no longer trade significantly above the cost structure”…
According to CPM Group, a New York-based metals consultancy, $2.80 is the total cost paid by some of the world’s highest-cost Copper miners to produce a pound of the metal…a sustained period at or below this price would force some mining companies to defer expansion plans and shutter unprofitable production…
Today’s Markets
China’s Shanghai Composite rallied strongly overnight, closing 47 points higher at 2245…analysts stated that comments from China’s Central Bank suggesting a widening of the yuan’s trading ban fueled the move…China was Asian’s top performing market for the week, climbing 1.7% to a 3-week high…European shares are up modestly in late trading overseas while U.S. markets are down for the third day in a row…as of 7:20 am Pacific, the Dow has retreated 38 points to 14499…the TSX is fighting to stay above the 12000 mark…it’s up slightly through the first 50 minutes of trading at 12008…the Venture, meanwhile, is at 936 for a gain of 3 points…
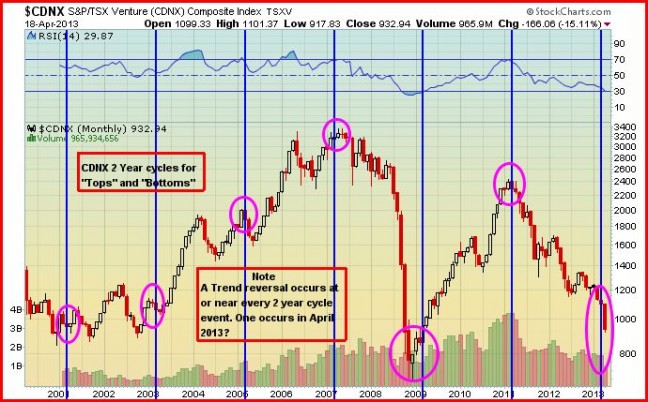
We certainly haven’t given up on the Venture, and it’s important to point out that critical reversals in this Index have tended to occur about every 2 years as shown in John’s chart below…this gives us hope that at some point during this second quarter, the Venture bear market may finally bottom out…the next major support level is 860…
CDNX – Gold Comparative Chart
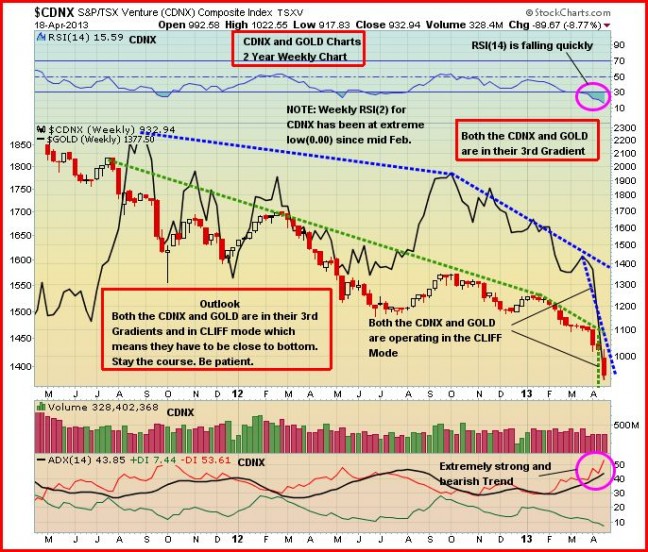
Below is a 2-year weekly chart from John that shows how the Venture and Gold are both currently in “cliff mode”, searching for a bottom which may not be far off but investor patience is critical…RSI(14) for the Venture on this 2-year weekly chart is at 15.59, an extreme level but it could very well fall a little more…
Giyana Gold Corp. (WDG, TSX-V)
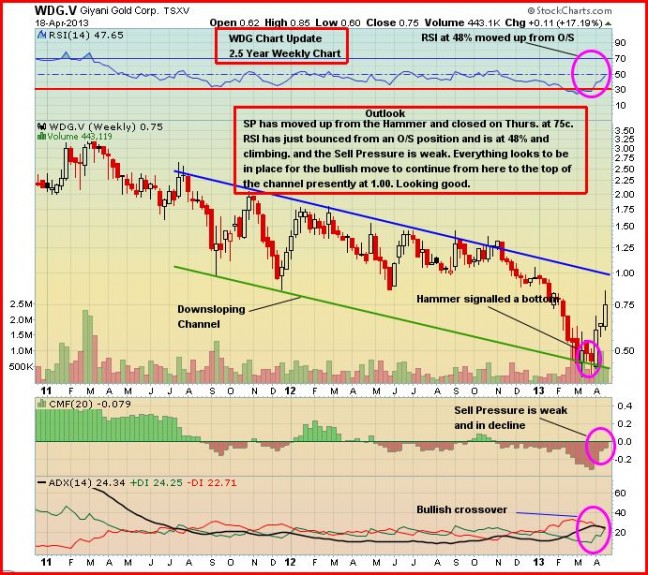
In the midst of these poor markets in April so far, it’s interesting to note that Giyana Gold (WDG, TSX-V) is up 63% this month based on yesterday’s closing price of 75 cents…it finished March at 46 cents…note the support and resistance areas within the channel over the past couple of years…
Note: John, Jon and Terry do not hold share positions in WDG.


4 Comments
any comments on one of your past favorites that started trading again today after many month under a Stop trading Order: Currie Rose!
Project is very interesting – platinum – in South Africa in a geological region known as the Bushveld Complex which produces most of the world’s platinum…it appears CUI could be the only junior, or one of the very few, juniors in this area…Harold Smith is a class act and this is a solid project he has put into the company…of course the challenge now, in the current market environment, is to complete a financing and move forward…this is worth watching closely for positive developments…
LOT trading halt…. see how high it can go this time… should be go lower than 19 cents… Should stay at 30+ cents… QIT 60 + cents
Great call on lot Theodore. Lmao. When the ruling classes come looking to cull the herd ill know where to send them first