TSX Venture Exchange and Gold
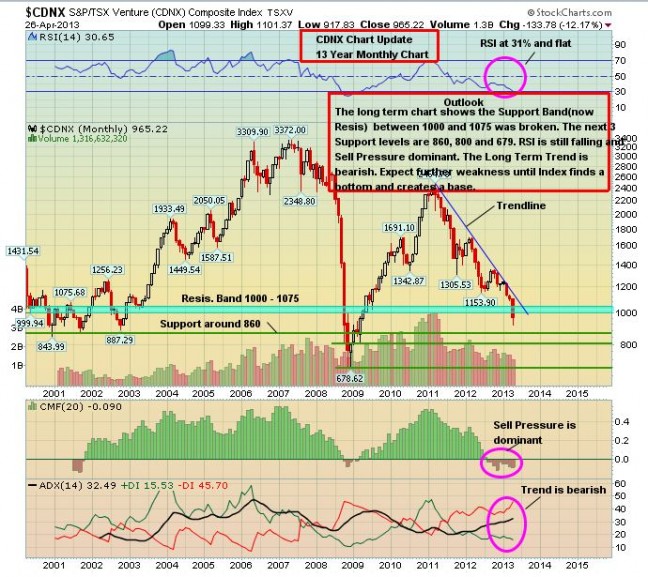
Mercifully, the Venture’s 11-week losing streak has finally come to an end. The Index climbed 26 points or 2.8% last week, closing at 965, as Gold staged a rebound. Volume, however, was light. The long-term trend is still bearish but it’s possible that a tradeable rally has started that could take the Index well into the previous support band (now resistance) between 1000 and 1075. For the first time since late January, the Venture has managed to crawl above its 10-day moving average (SMA) which has excellent potential to reverse to the upside early in the coming week – the last time this occurred was in late December.
One of the advantages of a market like this is that it take investors more time to react to excellent news (many are asleep at the switch). So while the market is slow and very frustrating for many investors, keep a close watch nonetheless on news releases and trading halts as there are still occasions – albeit rare – when something hits the wire that’s really eye-popping. A good example last week was Colorado Resources (CXO, TSX-V) which reported a drill hole Thursday that returned 331 metres grading .51% Cu and 0.67 g/t Au from its North ROK Property 190 km north of Stewart, B.C., near Imperial Metals‘ (III, TSX) Red Chris Mine Project. Colorado opened at 25 cents Thursday and closed up 38 cents at 54 cents. It gained 11 more pennies Friday to finish with a weekly gain of 333%. There are still opportunities in this horrible market.
Below is a 13-year monthly chart from John. We doubt that the Venture put in a “bottom” at the April 17 intra-day low of 918. But watch for a May rally and treat it as such – a rally out of oversold conditions with a new low coming later.
Gold
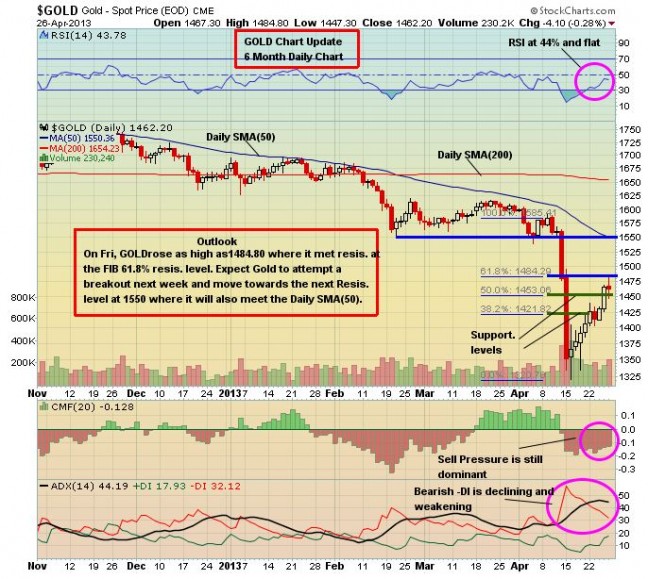
Not unexpectedly, Gold rallied last week out of technically oversold conditions due in part to a strong pick-up in physical demand out of Asia and elsewhere. U.S. Mint Gold bullion coin sales, for example, have hit 203,500 so far in April, the most of any month since December, 2009. The yellow metal has climbed in 7 out of the last 9 sessions since the historic sell-off of more than $200 an ounce. On Friday, Gold got as high as $1,485 where it hit Fibonacci resistance and then quickly sold off nearly $40 an ounce before recovering to close at $1,463 for a weekly gain of $57.
The coming week should be very interesting with three important events – a Federal Reserve meeting (Tuesday, Wednesday), a European central bank meeting (Thursday) and a U.S. monthly employment report (Friday). So we should expect some more volatility in Gold. China starts a 3-day holiday Monday, so this potentially could dampen some of the Gold demand coming out of that country.
Technically, one cannot rule out the possibility of Gold overcoming Fib. resistance in the $1,480’s and taking a run at $1,550 which previously of course was very strong support. That’s also where the 50-day moving SMA is at the moment. However, the primary trend is still bearish after that break below critical support at $1,550 and $1,500. At the very least, we do expect a re-test of the recent low in the $1,320’s at some point this year, while the worst-case scenario is Gold bottoming out around $1,000.
Below is 6-month daily chart from John. A move above $1,500 would certainly give a boost to Gold stocks, though we’d be very interested in the HGD (Horizons Bear Plus ETF for the S&P/TSX Global Gold Index) at $1,525-$1.,550 Gold.
Silver gained 75 cents last week, closing at $24.04. Copper gained 2 pennies to $3.17. Crude Oil climbed $4.99 a barrel to $93 while the U.S. Dollar Index fell one-quarter of a point to 82.47.
The “Big Picture” View Of Gold
As Frank Holmes so effectively illustrates at www.usfunds.com, the long-term bull market in Gold has been driven by both the Fear Trade and the Love Trade. The transfer of wealth from west to east, and the accumulation of wealth particularly in China and India, has had a huge impact on bullion. Despite its current weakness, the fundamental long-term case for Gold remains incredibly strong – currency instability and an overall lack of confidence in fiat currencies, governments and world leaders in general, an environment of historically low interest rates, a Fed balance sheet now in excess of $3 trillion and expanding at $85 billion a month, money supply growth around the globe, massive government debt from the United States to Europe, central bank buying, flat mine supply, physical demand, emerging market growth, geopolitical unrest and conflicts…the list goes on. However, deflation is prevailing over inflation in the world economy and this had a lot to do with Gold’s recent plunge below the technically and psychologically important $1,500 level. Where and when Gold bottoms out in this cyclical correction is anyone’s guess, but we do expect new all-time highs later in the decade. There are many reasons to believe that Gold’s long-term bull market is still intact despite a major correction from the 2011 all-time high of just above $1,900 an ounce.


2 Comments
BMR STILL SOUNDS PRETTY NEGATIVE ALL AROUND SINCE LAST WEEK YET WE HAD MAJOR REBOUNDS. PEOPLE ON THE RADIO ON MONEY TALKS SHOW STATE THAT 1700 BY JULY MIGHT NOT BE OUT OF THE QUESTION. SO, I GUESS EVERYBODY’S GOT THEIR OWN OPINION AND ARE JUST ‘GUESSING’!
zerohedge.com/news/2013-04-26/jpmorgan-accounts-993-comex-gold-sales-last-three-months
the big banks are speaking from bo th side of the mouth.