TSX Venture Exchange and Gold
Despite Gold’s $25 drop this past week, along with a 1.2% plunge in the Dow and a minor pullback in the TSX amid investor nervousness over the partial U.S. government shutdown and the debt ceiling issue, the Venture held its own with a slight weekly gain (2 points) thanks to Friday’s 11-point advance – matching the 2nd-best single-day performance by the CDNX in more than 2 months.
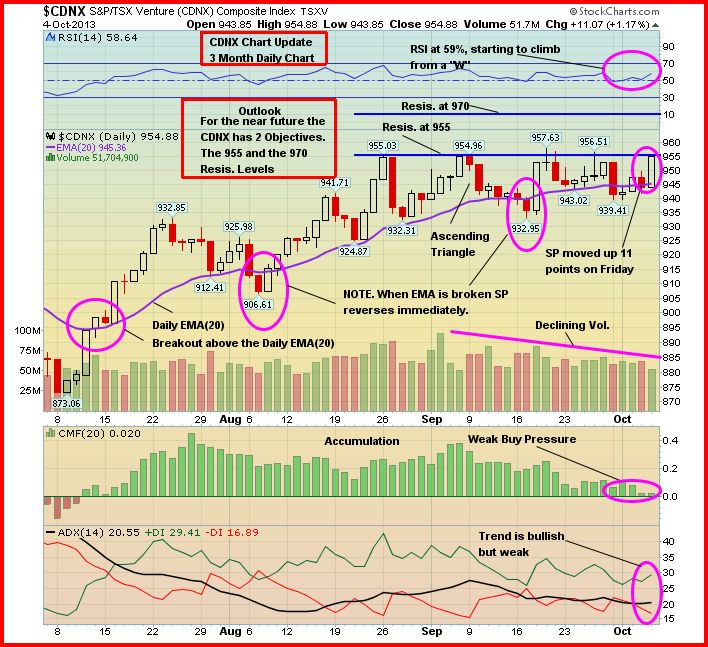
This is the Venture’s 4th attempt since September to push through resistance at 955. RSI(14), currently at 59% on John’s 3-month daily chart below, is showing up momentum after forming a bullish “W”, but volume and buying pressure both must increase in order for the Index to overcome the 955 resistance and the critical 970 level.
What’s interesting is that each time the Venture has fallen slightly below its supporting EMA(20), as it did again last week, it has quickly reversed to the upside. This kind of resilience is very encouraging. In addition, the Venture’s 100-day moving average (SMA) has flattened out and appears ready to reverse to the upside – this would provide fresh fuel for an assault on the 970 level.

Venture-Gold Comparison
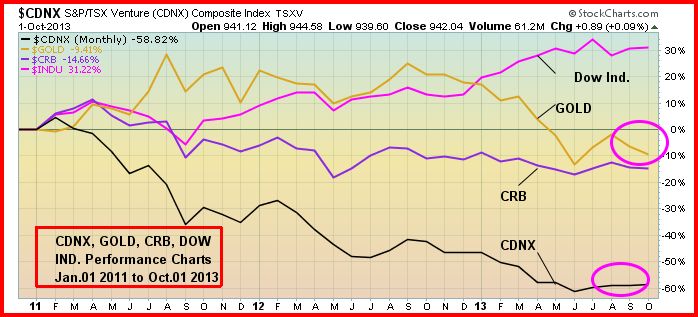
Changes in established patterns are always good clues as to future market developments/trends. What has been particularly intriguing recently is how the Venture has been holding steady and even moving slightly higher while Gold has been under some pressure since touching the $1,430’s in late August. The Venture has proven to be a very reliable leading indicator of the future direction of Gold prices (it turned lower several months ahead of bullion in 2011, for example). If Gold were about to collapse again, as some pundits are suggesting, we just wouldn’t be seeing the Venture hold up like it has these past several weeks. It would have broken down.
One could argue, actually, that the Venture is telling us Gold is gearing up for a substantial move higher – imminently, or a little further down the road. Only time will tell. But the pattern in the relationship between the Venture and Gold at the moment is unlike the pattern witnessed during the 2.5-year period beginning in early 2011. Below is a chart from John confirming this (note the circled areas). Whenever Gold has weakened, so too has the Venture – except now. This is a Venture–Gold-CRB-Dow monthly comparative since the beginning of 2011 (Gold has been moving in the opposite direction of the Dow for most of this year), and it’s additional evidence that the Venture found an important bottom in late June.

The Seeds Have Been Planted (And Continue To Be Planted) For The Next Big Run In Gold Stocks
There’s no better cure for low prices than low prices. The great benefit of the collapse in Gold prices this year is that it forced producers (at least most of them) to start to become much more lean and mean in terms of their cost structures. Among many others, Barrick Gold (ABX, TSX), the world’s largest producer, said it may sell, close or curb output at 12 mines from Peru to Papua New Guinea where costs are higher. Producers, big and small, have started to make hard decisions in terms of costs, projects, and rationalizing their operating structures. Exploration budgets among both producers and juniors have also been cut sharply. In addition, government policies across much of the globe are making it more difficult (sometimes impossible) for mining companies to put Gold (or other) deposits into production, thanks to the ignorance of many politicians and the impact of radical and vocal environmentalists. Ultimately, all these factors are going to create a supply problem – think about it, where are the next major Gold deposits going to come from? On top of that, a recent Mineweb study shows grades have indeed fallen significantly just over the past decade. For instance, grades in the South African Gold sector fell from an average of 4.3 grams per metric ton in 2002 to an average of 2.8 grams per metric ton in 2011. It doesn’t take a rocket scientist to figure out that the next huge bull market in Gold stocks is just around the corner due to demand-supply dynamics, much leaner producers who will suddenly become earnings machines, and a junior market that will be healthier simply because a lot of the “lifestyle” companies sucking money out of investors will simply disappear or get taken over by individuals or groups who are actually competent and serious about building shareholder value. A healthy “cleansing” in the market has been taking place. As this continues, more and more seeds are being planted for an incredible future move in well-managed Gold producers and explorers that could make the dotcom bubble look like a tea party. As for the juniors, focus on the small universe of companies that have the ability to execute both on the ground and in the market – companies that have the cash, the expertise, the properties and the drive to make discoveries that majors will buy.
Gold
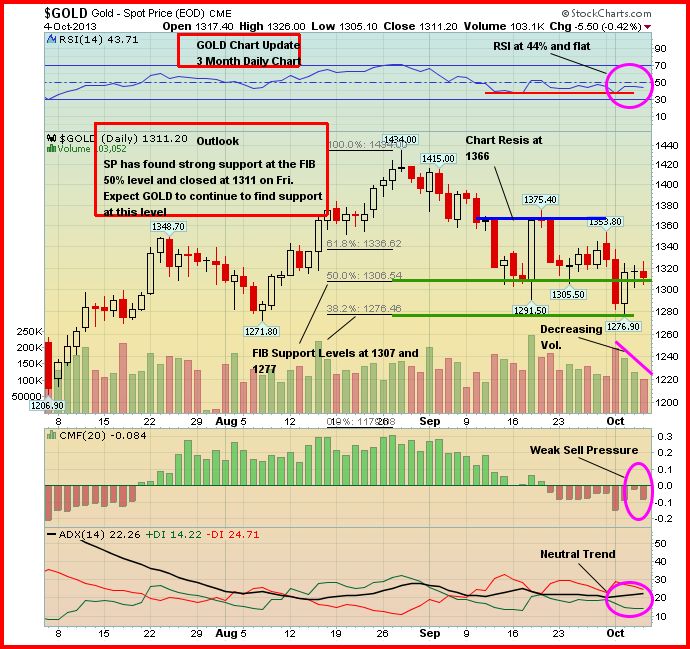
Gold had a volatile week but managed to hold important Fibonacci support in the $1,270’s on Tuesday when it rather mysteriously plunged more than $40 an ounce. Bullion closed Friday at $1,311, down $25 for the week. Support and resistance levels are very clear as you can see on John’s 3-month daily chart.
In his weekly Investor Alert at www.usfunds.com, Frank Holmes brought up an interesting point regarding Tuesday’s sell-off. “What has become evident is that Chinese buying is in fact very supportive of Gold prices. In an episode this past Tuesday – the first day of the market holiday closure in China – a big seller offered 10,000 futures Gold contracts for sale at a time of the day when European and U.S. buyers are not at their desks, leaving only Asia-ex China buyers to cross the sizeable trade. The resulting $41 per ounce price decline had the appearance of market manipulation.”
The Gold seller Tuesday was either desperate and stupid, or indeed this was market manipulation. Why wait until Tuesday when a holiday starts in China to unload 10,000 futures contracts? Anyway, Gold found support and recovered strongly the next day.

Silver fared better than Gold last week, losing only 4 cents to finish at $21.78 (John will have updated Silver charts Monday morning). Copper fell a penny to $3.28. Crude Oil gained nearly $1 a barrel to close at $103.84 while the U.S. Dollar Index slid nearly half a point to finish at 80.13.
The “Big Picture” View Of Gold
As Frank Holmes so effectively illustrates at www.usfunds.com, the long-term bull market in Gold has been driven by both the Fear Trade and the Love Trade. The transfer of wealth from west to east, and the accumulation of wealth particularly in China and India, has had a huge impact on bullion. Despite this year’s drop, the fundamental long-term case for Gold remains incredibly strong – currency instability and an overall lack of confidence in fiat currencies, governments and world leaders in general, an environment of historically low interest rates, a Fed balance sheet now in excess of $3.5 trillion and expanding at $85 billion a month, money supply growth around the globe, massive government debt from the United States to Europe, central bank buying, flat mine supply, physical demand (especially from China), emerging market growth, geopolitical unrest and conflicts…the list goes on. However, deflationary concerns around the globe and the prospect of Fed tapering by the end of the year had a lot to do with Gold’s plunge during the spring below the technically and psychologically important $1,500 level, along with the strong performance of equities which drew money away from bullion. June’s low of $1,179 may have been the bottom for bullion – time will tell. We do, however, expect new all-time highs as the decade progresses. There are many reasons to believe that Gold’s long-term bull market is still intact despite this major correction from the 2011 all-time high of just above $1,900 an ounce.

4 Comments
Interesting…comment about market manipulation in the asian markets. Would make sense to me that the asian central banks using the paper maker to drive prices lower to increase their physical inventory. Example being the chinese central bank rumor that it wants to increase it’s physical inventory by 10,000 tons….yes….tons.
CASTLE RESOURCES WEBSITE IS CURRENTLY DOWN FOR MAINTENANCE, CHECK BACK SOON
Any further comments on CCB? it looks like the correction may have been over on Friday at 19 low? Also, GGI should get going in October? Looked like Friday’s close up over 11pts was definetly encouraging for the TSXV.
Yes, I believe we’ll be doing a chart on CCB for Monday. Looks like a nice reversal. The fact the Venture is holding up so well is indeed very encouraging. I believe the odds favor a breakout here in Q4, just the way things have been shaping up since late June. October will be the breakthrough month for GGI, IMHO. That became very evident to me based on the Regoci interview, the first excerpt of which we’ll post tomorrow. And of course holes 4, 5 and 6 are coming from PGX. The first 3 holes essentially confirmed historical results, so the market took them pretty much in stride. These next 3 should confirm something completely new. If the market is looking for a “glory” hole, any 1 of those 3 may satisfy that craving.