BullMarketRun first uncovered Seafield Resources (SFF, TSX-V) when it was languishing at 6 cents last summer. It rocketed to 35.5 cents in late February before a sharp and unexpected pullback all the way down to 16 cents early this month. The stock closed Friday, May 28, at 18 cents and there is now overwhelming evidence that another major reversal is close at hand. BMR’s technical analyst reviews a very interesting Seafield chart below but there are also important fundamental reasons why we believe Seafield will be a very strong performer in the month of June.
Two events tell us that some very significant new “players” are now involved with Seafield: 1) The company’s record 10 million share day May 13; and (2) Seafield’s proposed $2.5 million private placement announced Friday.
Seafield didn’t have to do a financing right now, especially at current levels, but President and CEO Tony Roodenburg elected to do so we suspect because it made strategic sense. In otherwords, those participating in the financing must have some clout behind them and the ability to help the company in various ways.
Seafield will be ramping up its Colombian exploration efforts very soon with drilling to commence shortly at Dos Quebradas and/or Miraflores. Those are two excellent targets.
And in a positive development yesterday, Juan Manuel Santos – Colombia’s former defence minister and the market’s favored candidate – positioned himself for victory in what will be a runoff presidential election June 20.
Seafield has struggled the last three months but the good news is, the beaten-down share price has given us another great opportunity here – the stock is extremely attractive once again from a risk-reward ratio.
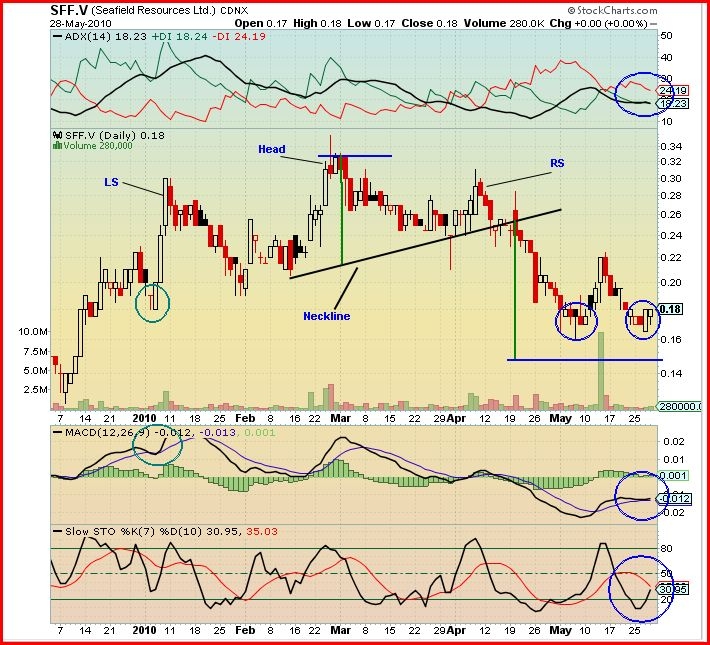
Seafield’s current chart confirms all of the above as explained by John below:
John: On Friday Seafield announced it “intends to complete a private placement offering of up to 14,285,714 units at a price of 17.5 cents per unit, for gross proceeds of up to $2.5 million. Each unit will consist of one common share of the company and one common share purchase warrant with each warrant entitling the holder thereof to purchase a common share at an exercise price of 25 cents for a period of two years following the closing of the offering. The offering is expected to close on June 4, 2010.”
Seafield opened at 17.5 cents Friday, traded as low as 17 cents and closed at the high of the day at 18 cents on 280,000 shares. The above announcement, together with the technical analysis of the chart, indicates that SFF is creating a base for a significant move to the upside in the near future.
Looking at the chart we see that starting in January of this year Seafield started to create a bearish reversal “head and shoulders” chart pattern. This is noted on the chart as left shoulder (LS) and right shoulder (RS). The lows between the LS and Head, and between the Head RS, are joined and the line (neckline) is extended as shown.
The distance in cents is measured from the top of the head to the neckline (10.5 cents) and then this same distance is measured down from the point at which the dropping price crosses down through the neckline (25.5 cents – 10.5 cents = 15 cents). This is a vertical green line. The target line is a short horizontal blue line. Thus the stock was expected to drop to about 15 cents. The low for the stock was 16 cents, reached on May 6, where it has found very strong support.
Between May 3 and May 28 Seafield formed a double bottom, a bullish reversal pattern (blue circles). The 10 million share day May 13 – by far the most number of Seafield shares ever traded in a single day – was highly significant.
Friday’s candle was a hammer (bullish reversal).
Looking at the indicators:
The ADX trend indicator shows the ADX (black line) trend strength is weak, thus the positions of the +DI and the -DI are inconsequential.
The Slow Stochastics has the %K (black line) about to cross up over the %D (red line) – very bullish.
I have not introduced the MACD indicator before so here is a short description for interested readers:
The MACD is an acronym for Moving Average Convergence-Divergence. MACD uses two exponential moving averages (12 period and 26 period). The difference between these two moving averages is the MACD line (purple). The trigger or signal line (black) is a 9 period exponential average of the MACD line (usually shown as 12/26/9). The common usage for this indicator is to recognize the crossovers of the MACD line and the signal line for buy and sell points.
In this case I’m looking at a signal called a “hook”. A hook occurs when the signal line attempts to penetrate the MACD line and then at the last moment reverses. See the two green circles. The result is a reversal in the price. The chart shows that this condition presently exists. This is bullish.
The market closed Friday with at least 500,000 shares on the bid at 17.5 cents – this is also bullish.
Outlook: A significant reversal situation has developed with Seafield Resources which can be expected to make a strong move to the upside as early as next month.

