Gold has traded between $1,315 and $1,331 so far today…as of 7:35 am Pacific, the yellow metal is down $17 an ounce at $1,318…Silver is off 14 cents to $20.14 (see updated Silver charts at the bottom of today’s Morning Musings)…Copper is unchanged at $2.94…Crude Oil has added 51 cents to $99.97 while the U.S. Dollar Index is up slightly at 80.18…on top of strikes in South Africa, the Ukraine crisis is further exacerbating fears of constrained Platinum group metals supply as Russia and South Africa provide around 80% of the market…a curtailment of supply would tighten the market significantly…Palladium crossed the $800 an ounce level this morning, reaching its highest price since August 2011…
 NATO’s top military commander warned yesterday that Russia was massing troops on Ukraine’s eastern border in a show of force ahead of President Obama’s arrival in Europe for talks on a united response to a crisis which has shaken the continent…Canadian Prime Minister Stephen Harper has used the most forceful language of any Western leader against Russia, stating over the weekend in Ukraine, “I think it is important that we in the free world not accept the occupation of Crimea, that we continue to resist, and sanction the occupation of Crimea, and that there be no return to business as usual with the Putin regime until such time the occupation of Crimea ends.” Investor holdings in exchange-traded products backed by bullion posted the first weekly decline in four last week…
Goldman Sachs’ most recent view on Gold which has been criticized by numerous analysts: “While we see clear catalysts for the recent rally in Gold prices, this move has been large relative to U.S. real rates which are a key input into our forecasts and benchmarking of Gold prices. As a result, we see potential for a meaningful decline in Gold prices towards the level implied by 10-year TIPS yields, which our rates strategists expect to rise further this year, and reiterate our year-end $1,050 Gold price forecast. More broadly, we believe that with tapering of the Fed’s QE, U.S. economic releases are back to being a key driving force behind Gold prices. As a result, we expect that the decline in Gold prices will likely be data dependent, in contrast to our 2013 bearish Gold view which was driven by the disconnect between stretched long Gold speculative positioning and stabilizing U.S. growth. Admittedly, a rebound in U.S. and Chinese growth this spring is a consensus view and a disappointment in either would lead us to delay our expected decline in Gold prices. However, it would require a significant sustained slowdown in U.S. growth for us to revisit our expectation for lower U.S. Gold prices over the next two years.”
There are at least two major flaws in Goldman Sachs’ bearish view on Gold – #1, their forecast is too U.S. focused – it doesn’t take into account the very robust underlying demand for physical Gold in China and elsewhere in Asia that’s underpinning the price of the metal; and #2, one of the key drivers of last year’s decline in Gold prices was ETF selling which has clearly stabilized – a major source of supply has therefore been removed from the Gold market in 2014…Goldman Sachs addresses neither of those issues…
The Indian government has eased import regulations to allow some of the country’s private sector banks to buy Gold from abroad in a move that could boost Gold imports in India and bring down physical premiums considerably…the Reserve Bank of India has allowed five private sector banks to participate in the import programs, according to a report from Mineweb, as the country seeks to prevent the flow of illicit money and smuggled Gold ahead of upcoming national elections…there is real potential for a significant jump in Gold buying from India this year, depending on political developments in that country…
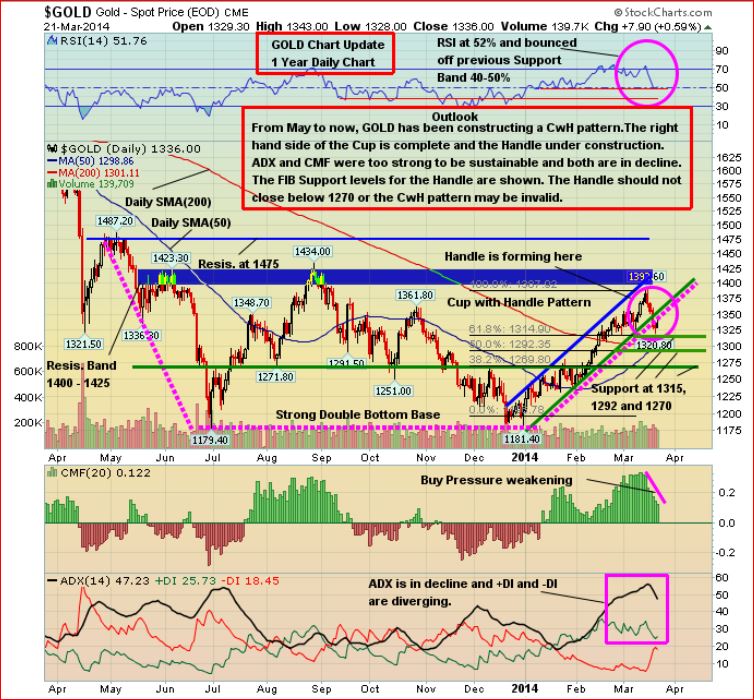
Updated 1-Year Daily Gold Chart
This 1-year daily chart for Gold shows an RSI(14) support band between 40% and 50% (52% entering today), a strong double bottom base, and the formation of a bullish cup-with-handle pattern since May of last year with the handle now under construction…note the Fib. support levels for the handle – between $1,270 and $1,315…a close below $1,270 would invalidate this pattern…
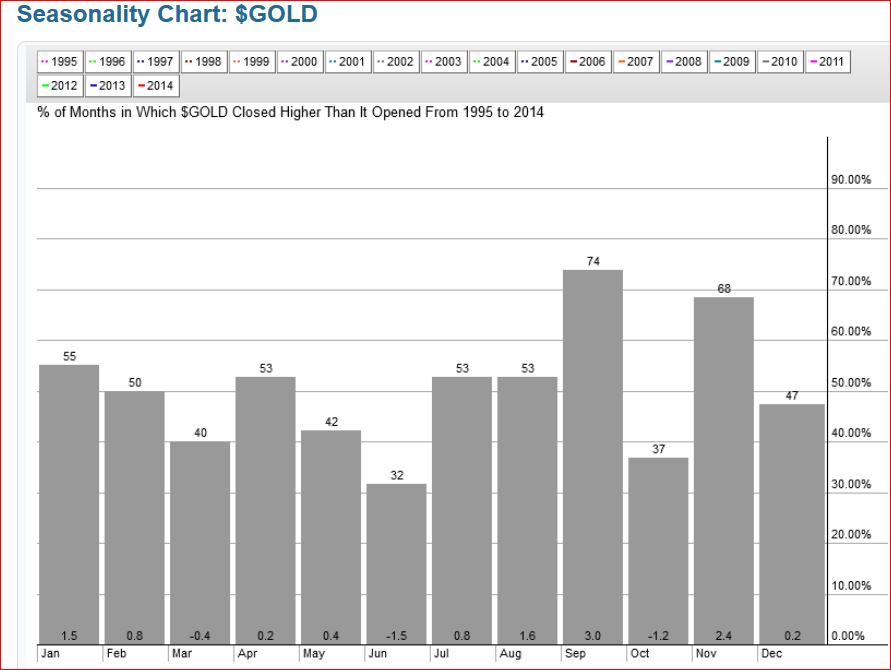
Gold Seasonality Chart
Historically, March has been the third-worst month for Gold…it’s now down slightly for the month of March after ending February at $1,329…
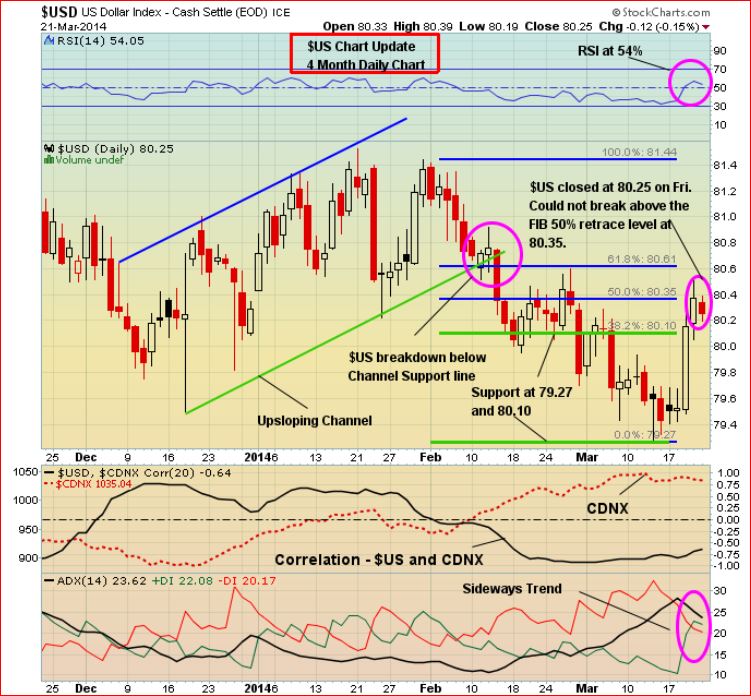
U.S. Dollar Index Updated Chart
A struggling greenback remains a positive factor for Gold…a declining 200-day moving average (SMA), currently around 81, will limit the upside potential for the Dollar Index while Gold’s 200-day has flattened out and should provide support for bullion around $1,300… John’s 4-month U.S. Dollar Index chart also shows Fib. retracement levels (resistance) at 80.35 and 80.61 – key areas to watch…
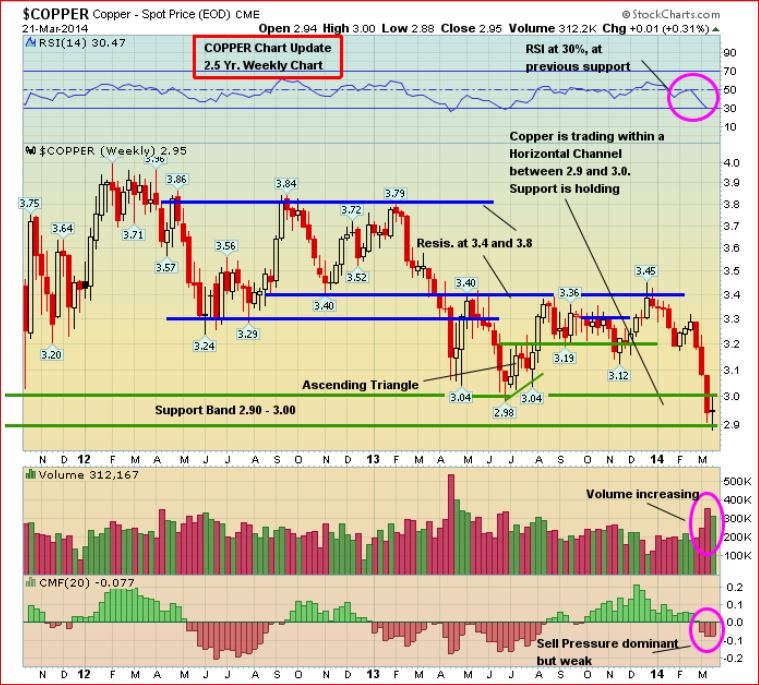
2.5-Year Copper Chart Update
Copper’s recent decline appears to have largely run its course with RSI(14) on this 2.5-year weekly chart hitting previous support at 30%…horizontal channel support is holding between $2.90 and $3.00…
Today’s Markets
Asia
China’s Shanghai Composite shook off some weak economic data and gained another 19 points overnight (building on Friday’s 3% jump) to close at 2066…HSBC’s preliminary Purchasing Managers’ Index, released today, hit an eight-month low at 48.1 in March…”Evidently, market participants are hoping that China will counter the threat of economic downturn by launching stimulus programs in a bid to prevent the economy from sliding,” said analysts at Commerzbank…
Caterpillar (CAT, NYSE) chairman and CEO Douglas Oberhelman doesn’t see a “doom or gloom” playing out in China…“Our customer base in China is fairly solid – we haven’t seen the number of defaults, past-dues, repossessions we had seen in the past. I’m not so worried about that,” he told CNBC Asia’s “Squawk Box” this morning…“I’m more worried about the pace of reform – opening of the capital market, moving to a market orientation to really propel the economy into the next phase,” he added. “We’re witnessing a continuing transition from a solid double-digit growth rate a few years ago, down to 7-8% and frankly we’re all caught up in that kind of a slowdown. That’s a big adjustment to make in a fairly short amount of time.”Oberhelman told CNBC Asia’s “Squawk Box” on Monday.
Japan’s Nikkei climbed 251 points overnight or 1.8% to finish at 14475…
Europe
European markets are down moderately but near session lows in late trading overseas…growth in euro-area manufacturing and services stayed close to the fastest since 2011 in March as France improved, providing further evidence that the region’s recovery is on track…
North America
The Dow is down 35 points as of 7:35 am Pacific…the TSX is off 44 points while the Venture is holding steady at 1035…
Fission Uranium Corp. (FCU, TSX-V) was halted pre-open and resumed trading at 7:30 am Pacific after the release of more stellar results (9 additional holes) from Patterson Lake South…PLS14-187 returned 53.47 m of total composite “off-scale” (>9999 cps) in 146 m of total composite mineralization, starting at a shallow depth of 58.5 m and closing the gap between the R390E and R780E high-grade zones…this hole is still in progress at a current depth of 407 m, in altered but unmineralized pelitic gneiss…FCU is up 6 cents to $1.67 after just 5 minutes of trading as of 7:35 am Pacific…Aldrin Resource Corp. (ALN, TSX-V), commencing a drill program at its Triple M uranium property, is showing strength in early trading today, up a penny at 11 cents on total volume (all exchanges) of 1.6 million shares…
13-Month Venture Chart
The Venture is holding up extremely well in the face of a 5% decline in Gold from its high last week…note the uptrend line on this 13-month daily chart, and keep in mind the Feb. 26 intra-day low of 1005 (the rising 50-day SMA is immediately below that)…there is tremendous support underpinning the Venture between the 970′s, an area of strong resistance last year, and 1005, limiting the potential of any near-term pullback from current levels to about 5%…some immediate weakness is understandable given the current posture of this chart including recent declining buy pressure…

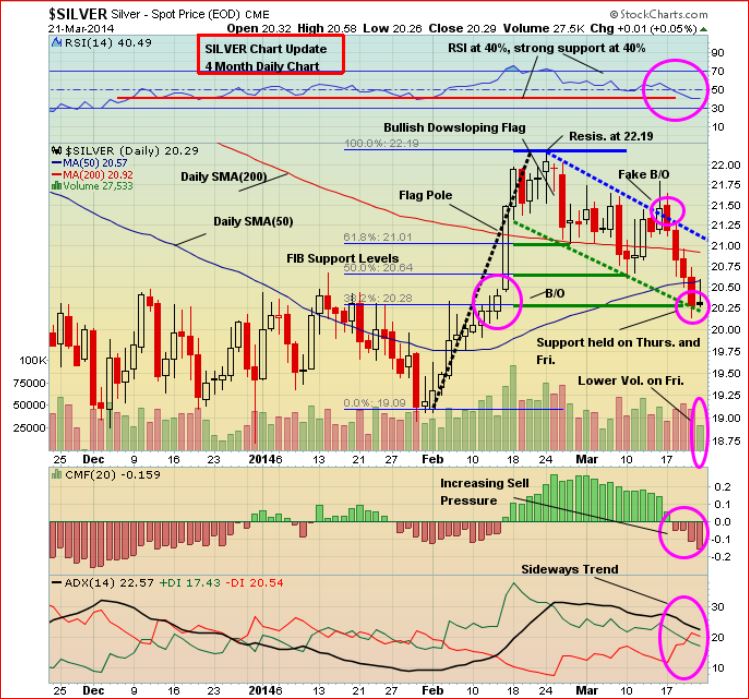
Short-Term Silver Chart Update
Silver is attempting to stay within a bullish downsloping flag and it’ll be interesting to see if there’s an intra-day reversal today that would keep the metal above the Fib. support level of $20.28 on a closing basis…RSI(14) on this 4-month daily chart shows strong support at 40%, so the conditions are right for a potential immediate or near-term reversal…
Long-Term Silver Chart Update
The long-term Silver chart confirms that the metal has exceptional support just below $20…sell pressure has been dominant since early last year but is weak…if and when Silver breaks above the main downtrend line, watch out…RSI(2) has unwound from above 80% to 46%…


7 Comments
In all honesty, I see gold going lower. The bears are in complete control of the gold market as of now, and it’s now time for the bulls to enter the market with some buying. I don’t see that happening unless we see some geopolitical uncertainty. Gold rose these past few weeks because everybody was certain that WW3 was about to break loose. That being said, this situation can bode well for DBV, AIX, GGI, PGX. If one of these companies hits something significant, money is going to come into these stocks, no doubt about it. For those who are looking for an entry point in DBV, now is a good time to enter before they officially begin drilling. After that, I am not to sure if you would be able to buy DBV’s stock under .025.
Hi john!
What if silver close under 20? How far can it go down? I dont understand all of this because the bullmarket is not over yet, so gold and silver ought to go much higher!!
Its all up to JPMorgan and the crooked US Gov’t, JP MORGAN is short big time silver and they are long gold, nothing happens with the price of gold and silver unless JPMorgan allows it to happen, someday I hope soon the physical buying will overcome this paper market, but im not holding my breath.
Hi Yvonne
There is chart support at 19.5 and very strong support at 19.
Regards
Jon, it has been a while since we saw anything on Rainbow Resources. Are they planning on doing any drilling this year or has this great looking land holding been put into mothballs for now? It certainly looks to hold potential so I am not sure if it is financing, market prices or ??? that is continuing to hold them back.
Caven Ventures- CVN, looking in to ” growing dope”
VVN- wow, also looking in to ” growing dope”.. All legal .. of course.. Who would of thought!!