Gold has traded between $1,281 and $1,290 so far today…as of 7:25 am Pacific, bullion is off $4 an ounce at $1,281…Silver is up 4 cents at $19.79…Copper is unchanged at $3.01…Crude Oil has shed 76 cents to $100.82 while the U.S. Dollar Index is off slightly at 80.07…

The world’s largest Gold-backed exchange-traded fund, New York’s SPDR Gold Shares, reported an outflow of 3.9 tonnes yesterday, its largest one-day outflow in nearly six weeks…
The discount to spot prices in China has been narrowing in recent days, indicating some buyers are coming back into the market…prices for 99.9% purity Gold on the Shanghai Gold Exchange were at a discount of about $1 an ounce today, compared with a discount of up to $8 recently…Gold needs fresh physical buying to keep prices at or above important technical support at $1,270…
Potential significant events for currencies and and Gold are looming later this week including the outcome of Thursday’s European Central Bank governing council meeting, and Friday’s U.S. non-farm payrolls data…
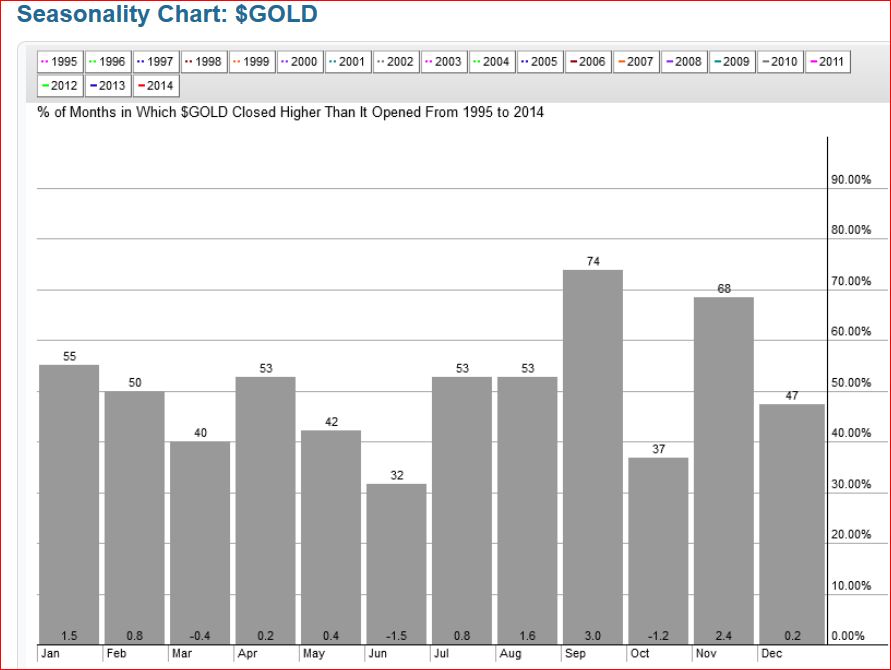
Gold Seasonality Chart
Historically, going back to 1995, March has been one of the worst months of the year for Gold as you can see in the chart below with this year being no exception as bullion fell 3.3% after closing February at $1,329 (February was the best month since July of last year)…last month, of course, Gold came within shouting distance of $1,400 but quickly retraced a lot of its gains since December of last year over the last couple of weeks…historically, April has been kinder to Gold than March…
Today’s Markets
Asia
Asian markets were mostly higher overnight, riding the wave of U.S. buying yesterday after comments from Federal Reserve Chair Janet Yellen who reassured investors, in a rather extraordinary way (see below), that the bank would maintain strong monetary support for the U.S. economy…China’s Shanghai Composite gained 14 points to close at 2047…Beijing’s official Purchasing Managers’ Index (PMI) rose to 50.3 in March from 50.2 in February, in line with analysts’ expectations…still, the figure was below January’s 50.5 figure…separately, HSBC’s final reading came in at 48, a touch below last week’s preliminary reading of 48.1…
Japan’s Nikkei bucked the trend, losing 36 points to close at 14792…
Europe
European shares are up significantly in late trading overseas after the release of a slew of economic data today…the euro zone manufacturing PMI, compiled by data company Markit, hit 53.0 in March, down from 53.2 the previous month, but still above the crucial 50 mark that signals growth…the figure is also below the January high of 54…“Despite having cooled slightly in March, the euro area manufacturing sector continues to enjoy its best spell of growth since early-2011. The rate of output growth remains encouragingly robust,” Chris Williamson, chief economist at Markit said in the accompanying news release…meanwhile, unemployment in the euro area remained stuck at 11.9% in February, hardly moving from this time last year, when the figure was 12%, according to the European Statistics Office, Eurostat…unemployment in Germany, however, fell for the fourth straight month…
North America
The S&P 500 has hit a fresh all-time this morning, while the Dow is up another 92 points as of 7:25 am Pacific…equities rocketed higher yesterday morning following a somewhat extraordinary speech from Fed Chair Janet Yellen that was interpreted as affirmation of her commitment to low rates until the economy is much stronger…as WSJ ace reporter Jon Hilsenrath observed, “While Ms. Yellen’s underlying message on Fed policy was unchanged, her delivery was striking. Central bankers tend to speak in terms of economic theory and statistics, in jargon better understood by investors and other economists than the broader public. Ms. Yellen instead exhibited a personal touch Monday by coloring her comments with experiences of three people who had struggled to gain full-time work.”
The TSX is up 32 points of as of 7:25 am Pacific while the Venture has climbed 6 points to 1001…
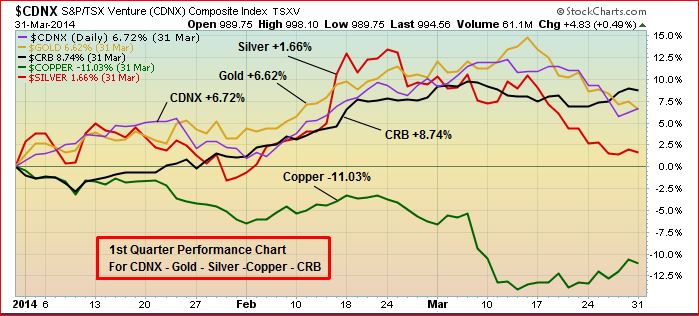
The Venture out-performed Gold, the Dow, the TSX and the Nasdaq in the first quarter of 2014, a very encouraging sign for the CDNX and a feat that likely hasn’t been accomplished in nearly three years…the Venture was up 6.7% in Q1 vs. a 6.6% jump in Gold, a 5.2% gain for the TSX, and a less than 1% advance in both the Dow and the Nasdaq…
Below is a quarterly performance chart comparing the CDNX with Gold, Silver, Copper and the CRB Index…the CRB came out the winner with a gain of 8.7% while Copper but clobbered with an 11% setback…
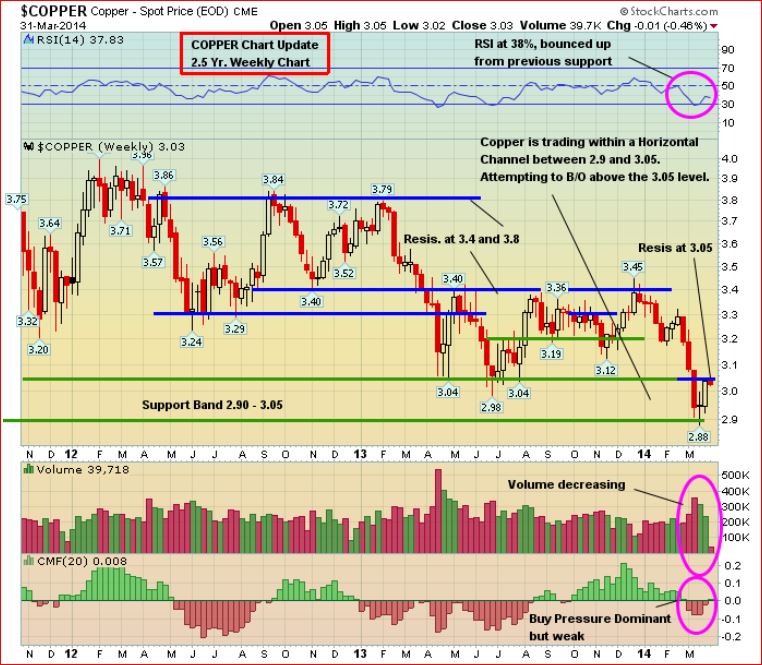
Copper Stabilizes, Holds Critical Support
Copper has clearly stabilized after a 16.5% sell-off from a high of $3.45 near the end of last year…weak buy pressure has now replaced sell pressure which emerged on this 2.5-year weekly chart in late February…RSI(14) bounced off support last month at 30% as the metal traded as low as $2.88 but nonetheless remained within a support band…a re-test of support around $2.90 certainly can’t be ruled out while the next immediate resistance is $3.05…
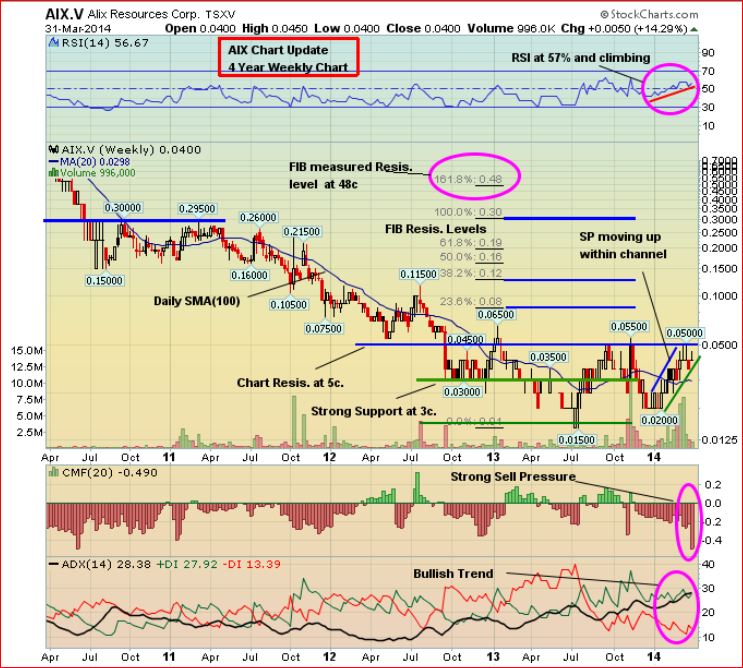
Alix Resources Corp. (AIX, TSX-V) Update
Alix Resources Corp. (AIX, TSX-V) is going “all-in” on the Sheslay Valley Cu-Au porphyry district, rapidly shaping up to be British Columbia’s exploration hotspot in 2014 with drilling in the area already underway (Doubleview Capital Corp., DBV, TSX-V)…Alix has impressively raised over half a million dollars, as announced yesterday, which demonstrates that the company’s strategic land package covering about 90 sq. km is beginning to resonate with investors…it’s important to note that Alix, which is proceeding immediately with a work program in the Sheslay camp, has managed to secure ground contiguous to the entire northern border of Prosper Gold Corp.’s (PGX, TSX-V) Sheslay Property, as well as land packages contiguous to much of the northwestern border of Garibaldi Resources Corp’s (GGI, TSX-V) Grizzly Property and the northeastern border of DBV’s Hat Property…in addition, AIX is well-positioned in Sheslay South with a NW/SE trending package that stretches for as much as 18 km…trading at just 4 cents, AIX could literally explode on good news from any of its neighbors or encouraging results from any of its four project areas in the Sheslay Valley…
Below is a 4-year weekly AIX chart from John that shows an impressive RSI(14) uptrend and a share price in an upsloping channel with a now rising 200-day moving average (SMA)…these are powerful signals for what may lie ahead for AIX and all the plays for that matter in the Sheslay district…as always, perform your own due diligence…AIX is unchanged at 4 cents as of 7:25 am Pacific…
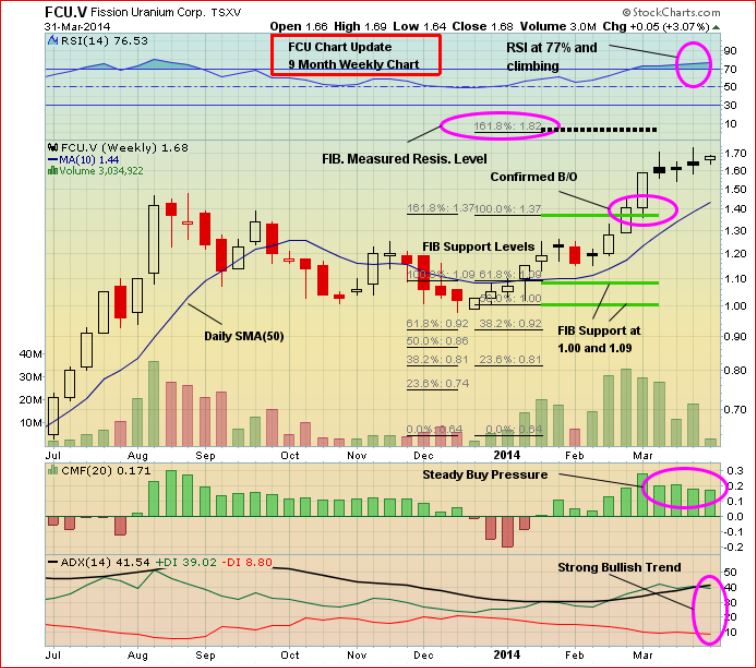
Fission Uranium Corp. (FCU, TSX-V) Updated Chart
Fission Uranium (FCU, TSX-V) released more impressive results yesterday from Patterson Lake South and continues its march toward Fib. measured resistance at $1.82…that’s not a price target, just a theoretical level based on Fib. and technical analysis…as always, perform your own due diligence…FCU is off a penny at $1.67 as of 7:25 am Pacific…it has climbed more than 50% so far this year…
Note: John and Jon both hold share positions in AIX.

4 Comments
Looks like more interest in cck this am
Good to see that they want to put their 2 mil in cash to work
aix,heck i’ll add at 4 cents no matter what that dipstick thinks he’s doing.good one chart trader.made me have a chuckle.
CCK-V Nice call, whoever it was!! And CVN-V is very active today, should dump it but who knows with these potential” pot” stocks?
In the case of CCK, Greg, I like the fact that they’ve got money, that was what particularly got me excited in addition to their announcement…some of these companies getting into this sector will be slow (or slower) out of the gate with little or no cash initially…