Once each week on BMR, our technical analyst will highlight one or more resource stocks (outside the BMR Portfolio) that show very favorable chart patterns. Investors of course should perform their own due diligence and consider fundamental factors as well. This weekly feature is merely meant to introduce some possible opportunities that investors may wish to follow up on. This morning, John takes a look at a company called Barkerville Gold (formerly International Wayside) which trades under the symbol BGM on the TSX Venture Exchange:

John: Barkerville Gold Mines (BGM, TSX-V) made a recent high of $1.40 April 15 and then sank to a low of 67 cents June 14. Technically, the stock clearly appears to have bottomed out and closed yesterday at 74 cents. As of 8:45 am Pacific time this morning, BGM is up another 6 pennies to 80 cents. What’s happening here?
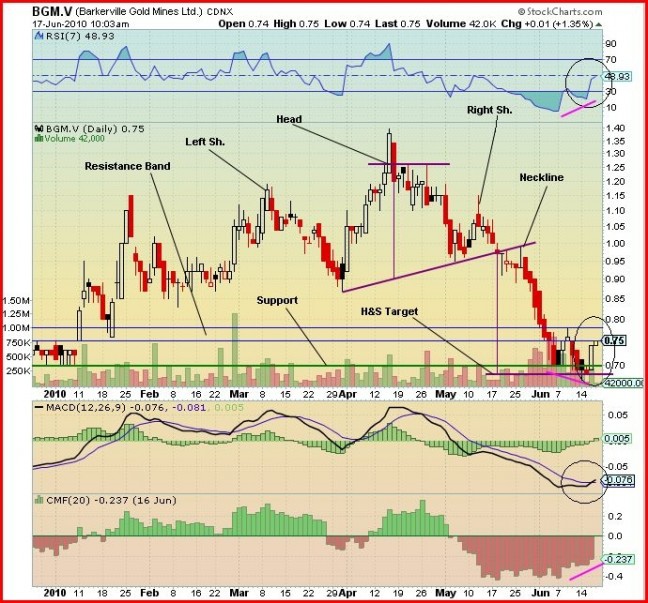
Looking at the 6-month chart we see that a Head and Shoulders pattern formed with the top of the head at $1.40. But due to the immediate reversal I chose the effective head at the next resistance level below. After forming the Right Shoulder the stock price broke down through the Neckline on May 18 and fell quickly to the low of 67 cents. It has since bottomed out at the support level of 70 cents (green horizontal line).
I have also shown a resistance band (blue horizontal lines).
Looking at the indicators, we see that there is a divergence between the RSI and the stock price (mauve lines) and the RSI is climbing upward and very close to crossing the 50% line which can be interpreted as a buy signal.
The MACD has crossed over its signal line and has turned up toward the zero line. This is very bullish.
The Chaikin Money Flow indicator is moving toward the zero line, showing that the buying pressure is accelerating.
Outlook: BGM has turned around and could make a strong move to the upside. If it can overcome the resistance, and it appears that may be happening now, there should be no formidable resistance to at least 90 cents. This looks very bullish.
