
Gold has traded between $1,202 and $1,214 so far today…as of 8:30 am Pacific, bullion is up another $4 an ounce at $1,211 after yesterday’s rally…Silver is down 14 cents at $17.21…Copper is off 2 cents at $3.04…Crude Oil (see updated chart below) has fallen 97 cents to $89.36 while the U.S. Dollar Index is flat at 85.84…
 Bullion enjoyed its its biggest 1-day gain in 2 months yesterday as the dollar rally paused and some physical demand emerged…it’s encouraging that over the past week, while the Dollar Index surged to a 4-year high while Chinese traders were largely absent due to the National Day holiday there (it ends today), bullion has held slightly above its 2013 double bottom low…current conditions are certainly a breeding ground for a potential major rally – sentiment toward Gold is very negative and short positions are high…meanwhile, the “smart money” commercial traders have been busy dramatically scaling back their net-shorts in recent weeks to levels that typically precede a significant upside move in bullion…the balance of October is going to prove to be very interesting…there are reasons for optimism but also caution…citing his Hulbert Gold Newsletter Sentiment Index, Mark Hulbert warns this morning that there’s not enough “absolute bearishness” at the moment in Gold to declare a significant bottom, and he may very well be right…
Silver has some work to do – significant technical resistance exists around $17.50…a close above last week’s high of $17.64 would bring some confidence back into that market…
The IMF has downgraded its global growth forecast for both this year and next as a divergence emerges between those economies that are recovering, and those that are not…the organization, which represents 188 countries, now expects world growth to come in at 3.3% in 2014, down 0.1% from its forecast in July…in 2015, it expects growth to pick up to 3.8%, though that estimate is down 0.2% from earlier…
Today’s Equity Markets
Asia
Japan’s Nikkei average fell 107 points overnight to close at 15784…trading in China’s Shanghai Composite resumes tomorrow after a week-long holiday break…
Europe
European markets were moderately lower today…German industrial production fell more than economists forecast in August in the latest sign that the outlook for Europe’s largest economy – and the euro zone in general – is deteriorating…production, adjusted for seasonal swings, dropped 4% from July, when it expanded 1.6%, the Economy Ministry in Berlin said today…that’s the biggest decline since January 2009 and compares with a median estimate of 1.5% in a Bloomberg News survey…
North America
The Dow is down 161 points as of 8:30 am Pacific…results from aluminum producer Alcoa (AA, NYSE) will kick off the latest slew of quarterly earnings tomorrow, and a further eight S&P 500 companies will post results before the week is out…also tomorrow, investors will be closely analyzing minutes that will be released from the recent FOMC meeting for a clearer picture on future policy…
Despite an improving economy and the lowest unemployment rate in 6 years, Americans’ views of President Barack Obama’s economic leadership stands at the lowest level of his presidency, according to the latest CNBC All-America Economic survey…
The TSX is off 14 points while the Venture is down another 6 points at 862, just 3 points above the June 2013 low…that’s also a 15.7% correction in just 26 trading sessions (22 losing sessions out of 26)…
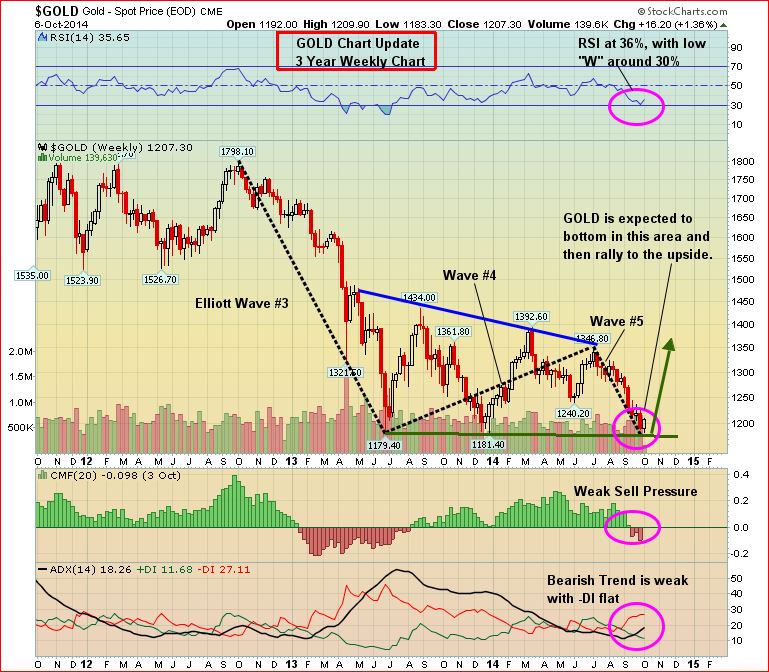
Gold 3-Year Weekly Chart
Here’s one bullish view on Gold from John based on a 3-year weekly chart, and it assumes key support at $1,180 holds…what will be critical to watch for on this chart as the month progresses is a quick reversal in sell pressure…the recent change from more than a year of buy pressure to sell pressure has to be a concern…the last switch from buy pressure to sell pressure occurred at the beginning of 2013, and we all know what happened over the next several months…on an encouraging note, RSI(14) formed a bullish low “W” at 30% and is now moving higher…the balance of October is going to reveal how strong Gold’s support is at $1,180 and if physical demand can give bullion some needed traction…
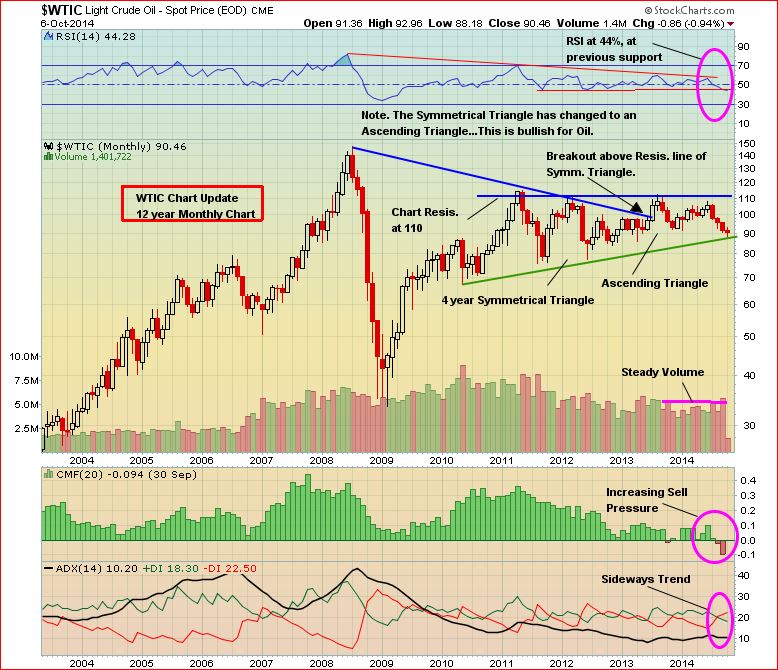
Crude Oil (WTIC) Long-Term Chart
Crude Oil has been smacked hard the last few months and – very interestingly – has touched support at the bottom of an ascending triangle on this 12-year monthly chart….RSI(14) is at previous support, so this is really a critical period as well for WTIC…like with the 3-year weekly chart for Gold, increasing sell pressure has replaced an extended period of buy pressure, so that’s a red flag…WTIC needs to hold support…
Doubleview Capital Corp. (DBV, TSX-V) Update
The discovery of a new Cu-Au porphyry deposit in the Sheslay district of northwest B.C. is much more evident this morning following yesterday’s post-market release of assay results from the 7 latest holes drilled at the Hat Property by Doubleview Capital Corp. (DBV, TSX-V)…they included the best grades intersected so far at the Hat including a 118-m section in the last hole (HAT-22) that returned 0.55% Cu and 0.41 g/t Au within a much broader mineralized interval (404 m @ 0.40 CuEq)…tonnage is building at this property – just about every hole is returning long intersections – now the key of course is to follow the trail of higher grade material while also continuing to expand the Lisle Zone which remains open in all directions…the distance between HAT-06 and discovery hole HAT-08 is a full kilometer, and there are numerous quality targets with geophysical and geochemical signatures surrounding the Lisle Zone that have yet to be drill-tested…
This is a fresh discovery on a proven trend that’s still in its early stages with huge potential upside after just 22 holes…more drilling is expected to begin shortly…we’ll be going into much more detail regarding the Hat Property, and the Sheslay district as a whole, in the very near future…
Not surprisingly, after 4 straight days of gains that preceded yesterday’s news, DBV is pulling back slightly in early trading today…it’s staying within technical parameters and there’s no big volume sell-off which is encouraging…DBV has slipped 2.5 cents to 18 cents as of 8:30 am Pacific…

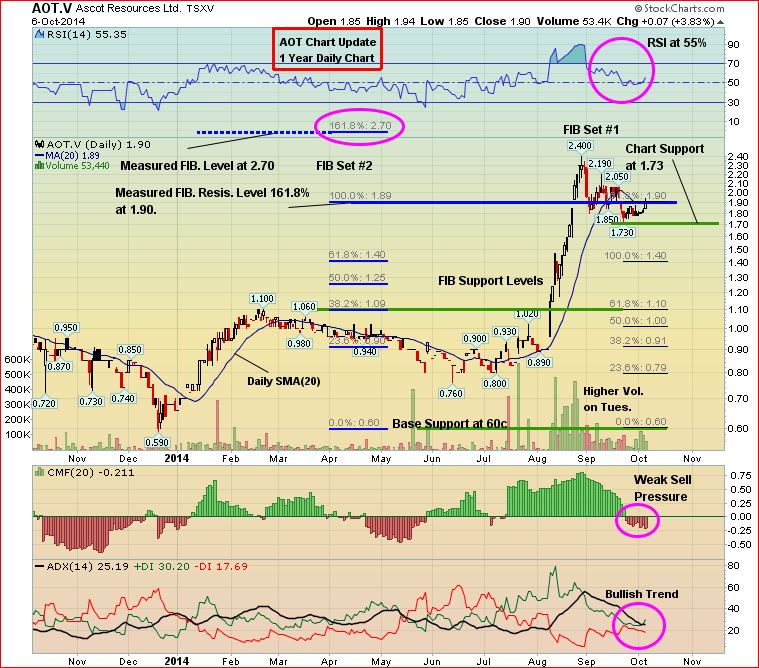
Ascot Resources Ltd. (AOT, TSX-V) Update
Ascot Resources (AOT, TSX-V) went on a major run in August thanks to results from its Premier Property in the Stewart area of northwest British Columbia, and the temporarily overbought technical condition that John pointed out has now cleansed itself…
Drilling has recently been focusing on the old Premier mine area, as reported August 22 – Ascot’s last update on the project…plenty of high-grade targets exist at this past producer…the system has a known strike length of over 1,600 m and a dip length of up to 1,200 m but a majority of the target area has only been loosely tested from underground, with most work dating back to the 1920’s to 1930’s…
In March of this year, Ascot released updated mineral resource estimates covering the Big Missouri, Martha Ellen and Dilworth areas at the Premier Property totaling 4.6 million ounces AuEq (see March 31 news)…
Technically, strong support has been forming in the $1.70’s, slightly above the still-rising 50-day SMA…the 20-day SMA went into decline during the last half of September but has now flattened out at $1.89…
AOT should be watched closely – while the chart is encouraging, we suggest waiting for the company’s next update which should provide investors with clear insight into the stock’s near-term direction…
AOT is down 9 cents at $1.81 as of 8:30 am Pacific…
Two Interesting Non-Resource Charts
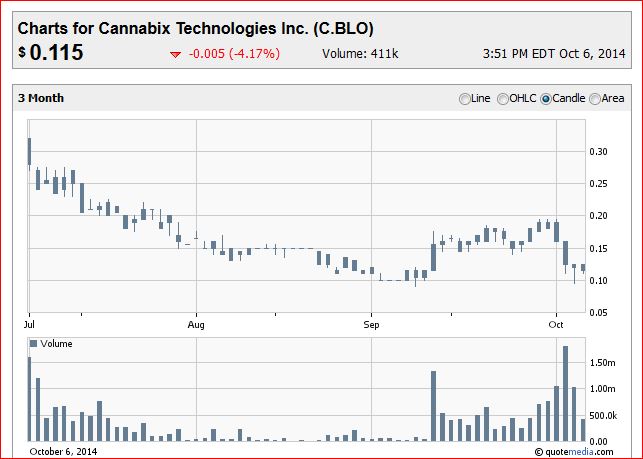
We’ve seen plenty of overall market volatility so far this month, and that was clearly evident in the trading of Cannabix Technologies Inc. (BLO, CSE) last week as it climbed as high as 19.5 cents and then dropped in half in just 2 trading sessions before stabilizing…Friday afternoon, we spoke with CEO Rav Mlait who confirmed the company is on track with all of its plans – in other words, there was no logical reason for that kind of a sell-off other than a few investors who may have had to raise some cash in a hurry…that’s the nature of these speculative and turbulent markets…that’s also how opportunities are created…
We see tremendous opportunities for BLO with its patent-pending marijuana breathalyzer technology, and interest from the U.S. in this company continues to grow which is a very positive sign…
Technically, BLO may have formed an important double bottom as you can see on this chart below…volume has picked up significantly in BLO on the CSE since mid-September, and trading volumes have been increasing in the U.S. as well…
BLO is up half a penny at 12 cents through the first 2 hours of trading today…
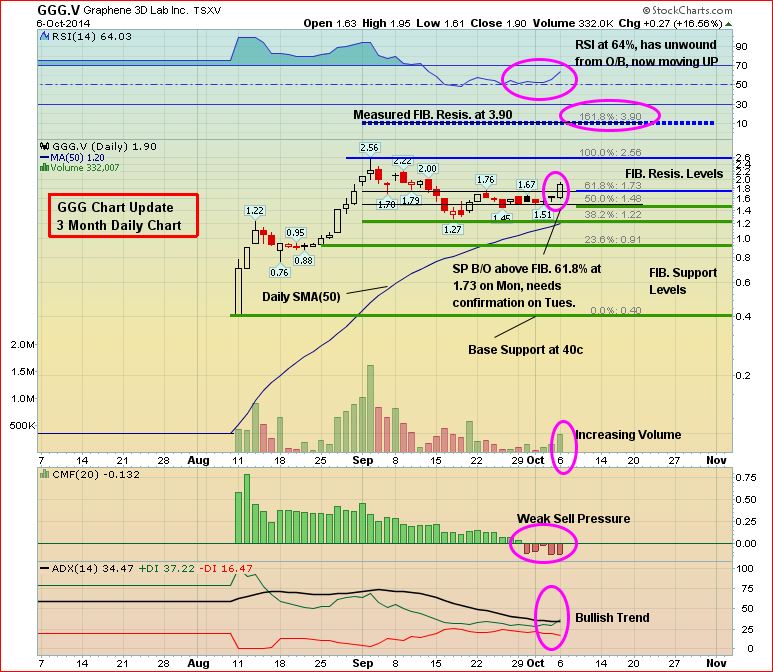
Graphene 3D Lab. Inc. (GGG, TSX-V) Update
We first mentioned Graphene 3D Lab (GGG, TSX-V) in mid-August, shortly after it made its debut on the Venture and climbed from a low of 40 cents to more than $1 in the first two trading sessions…
This is just a chart update to help readers with their own due diligence – as always, we encourage investors to contact management and perform their own DD on any company they might be interested in…
After climbing as high as $2.56 in early September, GGG quickly retraced to the Fib. 38.2% level around $1.22 where the rising 50-day SMA currently sits…since then, GGG has been gradually climbing again and closed yesterday at $1.90…it’s up another 6 cents to $1.96 as of 8:30 am Pacific…
RSI(14) has unwound from extreme overbought conditions, finding support at the 50% level, and is now heading higher again…
Note: John and Jon both hold share positions in BLO. Jon also holds a share position in DBV.
20 Comments
Jon… do we know if the patents that have been aplied for are both in the US and canada??? assuming they have been applied for yes?? are you aware of other patents that may be applied for?
searched for the patent and nothing came up
thanks in advance!!!
Hi Jeremy, good question…this comes straight from the MD&A…I’m sure Rav can provide some more background detail if you contacted him directly…”On May 13, 2014 the company entered into a binding letter of intent (“LOI”) with Cannabix Breathalyzer Inc (an arm’s length party). On June 5, 2014, the Company and Cannabix entered into a definitive licensing agreement. The definitive licensing agreement (“definitive agreement”) provides West Point Resources Inc. (the licensee) exclusive right, title, and interest in United States Patent Application Serial No. 61/981,650No. 1 (“Licensed Patent”) from Cannabix (the licensor). The territory covered in the agreement is the United States and its territories and possessions, and all other countries that are deemed to constitute the North American Continent. In consideration for the Licensed Patent, the Company issued 7,500,000 million common shares to current shareholders of Cannabix Breathalyzer Inc. and issued 7,500,000 million warrants exercisable at $0.075 (exercisable for a period of 12 months, expiring on June 26, 2015) to Cannabix Breathalyzer Inc.
venture currently below 860pts… Where is the bottom? Another 100pts below?
Tony T
We bottomed at 686 in 2008 & the question remains today, where is
that darn bottom. Some stats. for reader’s information…
+++++++++++++++++++++++++++++++++++++++++++++++++++++++
TSX Venture Exchange…Buy or Sell?
Aaron Hoddinott’s picture
Written by Aaron Hoddinott
Pinnacle Professor
April 29, 2012
Categories: Commodities, Mining, the Venture, TSX Venture, TSX Venture Exchange, TSX Venture Index
More Sharing ServicesShare | Share on facebook Share on myspace Share on google Share on twitter
Login or Register
Printer-friendly version
Fellow investor,
The TSX Venture has been the worst performing stock exchange in North America for over a year now.
For many companies on the TSX Venture, this is a time period filled with anxiety; much like it was in late 2008, the Venture has fallen to the hands of panic sellers. Investors are scared and have been thinking illogically for several months now. Companies that were being bought for $1.00 per share with heavy volume, just 12 months ago, are having a hard time finding bids in this market for $0.30. Volume and risk appetite have vanished. Again, this is similar to how it was in December of 2008 in that respect.
It’s funny how quickly the psyche of investors can change. And this latest correction in the TSX Venture (a 1 year collapse in value of roughly 45%), is a testament to how powerful emotions are when it comes to moving markets.
This latest correction is the second worst (from a percentage standpoint) in the TSX Venture’s history – yet commodity prices remain at historically high levels and the Dow continues to shake off all negative macro-economic data.
Venture investors are scratching their heads as to why this is happening.
The truth is that the TSX Venture has always been a boom/bust exchange. It’s extremely volatile. The exchange has existed for 11 years and during that time, it has gone through 7 bear markets of its own (market downturns of 20% or more).
Let’s think about the global economic situation for a few seconds. What has really changed in the last 12 months that would cause the Venture to lose 45% of its value?
Last year we were all well aware of Europe’s debt crisis and the potential for it to spill into other countries. We were all well aware that America’s national debt was skyrocketing out of control. We knew inflation was going to hit the world in a meaningful way (good news for commodity plays), but didn’t know exactly when. We knew China’s growth was going to temporarily slow down. Commodity prices were flirting with record high levels. Unemployment in the Western World was historically high. What’s changed?
The answer is nothing. Uncertainty has hung around the market for a couple years now. The only thing that has changed is the date on your calendar. We are living in just as uncertain times as we were in April of 2011. As mentioned, this hasn’t bothered the Dow Jones. It has continued its ascent to flirt with record highs. Meanwhile, the TSX Venture, an exchange that is heavily weighted in commodities, and more specifically, mineral exploration, has collapsed.
If you had been living under a rock for the last 12 months and woke up looking at a one year chart of the TSX Venture, you would make the assumption it has fallen because gold, copper, silver and oil have probably dropped in value at a rapid rate. This is of course, not the case. Sure, gold and silver have come off their record highs in 2011, but they still remain at historically high values. The miners of these two precious metals are making record margins. Fundamentally, that is fantastic news for the TSX Venture and the explorers which trade on the exchange. However, the reality is quite different than fantastic. Share prices of these exploration companies have been decimated over the last 12 months. This sell-off has been entirely fear driven. Uncertainty and long-term unknowns, in respect to many of the largest economies in the world, have taken the risk appetite out of the markets and left the Venture alone at the bottom of a dark hole.
Fear has taken over the TSX Venture and the last time that happened, the greatest buying opportunity of our lifetime knocked on the door.
The TSX Venture is Trading at the Same Level it Did Nearly 9 Years Ago
In October of 2003, the TSX Venture Exchange traded at the same level it does today. What’s important to note about October 2003 is that gold traded for roughly $380 an ounce – it trades 425% higher today. In October of 2003, silver traded for about $5 an ounce – it trades 600% higher today. In October of 2003, a barrel of oil traded for $30 – it trades 320% higher today. In October 2003, Comex copper traded for $0.92 – it currently trades 415% higher.
Aside from these commodities trading near record highs (the main commodities the 1275 explorers/miners on the venture are drilling for), it has become increasingly difficult for explorers to make economic discoveries. Many of the world-class deposits are being mined right now because of the record high prices. Simply put, there isn’t nearly as many world-class commodity assets on the globe as there were in 2003. So wouldn’t it make sense that these companies, with proven discoveries, be valued higher in this market environment?
Fortunately for us bottom fishers, ‘risk’ has become a dirty word. This mindset has resulted in fire sale prices on many great investment opportunities within the TSX Venture Exchange.
As everyone already knows, the TSX Venture is predominantly a mining and commodity based exchange. Its value, historically, has risen and fallen with the price of commodities. There are 1,275 mining/exploration companies on the TSX Venture alone – no exchange on the planet even comes close to that amount. It’s the ‘go to’ exchange when looking to invest in the next major discovery.
Looking Back on The TSX Venture’s Many Downturns and the Amazing Opportunities That Have Always Followed
The TSX Venture is no stranger to volatility and sharp corrections. It’s a small-cap exchange comprised mainly of exploration companies – both early-staged and advanced.
The exploration companies on the Venture don’t cash-flow, that’s not what they’re about. These companies are about making discoveries and being bought out, or years later going into production and then cash-flowing. When a company doesn’t cash-flow and only drills, it must regularly go to the market for financings. This creates uncertainty and volatility. This creates the fear factor we are seeing in the market right now. During uncertain times, investors are fearful that many companies on the Venture won’t be able to raise capital and could potentially dissolve. This, in most cases, is an irrational fear. Many companies have deep pocketed management teams which can raise capital in any market. Some companies won’t need to raise capital for another 2 years. Let’s not forget that we recently came off the greatest rally in the TSX Venture’s history (December 2008 – March 2011) and the fundamentally sound explorers were able to raise major cash at much higher levels than today. Many of these prudent juniors are sitting on several million dollars in their treasuries from previous financings.
Let’s also not forget how nimble these junior explorers can be when hard times hit. These companies don’t have hundreds of employees on the payroll. Drillers are typically on contract work and many of these junior explorers have a dozen full-time workers or less. A junior with a burn rate of half a million dollars a month can quite easily cut that down to $50k by stopping drilling during a down market. After all, as you will soon see, a typical bear market for the TSX Venture only lasts 5.8 months anyway.
Because of the Venture’s capital intensive business models (particularly with its 1275 mining/exploration companies), it should come as no surprise that this exchange has experienced 7 bear markets (a correction of 20% or more) in its 11 year history.
Ten Year Chart for the TSX Venture – source: quotemedia.com
History of Major TSX Venture Corrections And What Followed
(I define a major correction as a 20% decline or more in the overall TSX Venture Index)
The TSX Venture officially formed in 2001. Its starting value was 1,000.
The TSX Venture’s first major correction began on June 4, 2002 after it hit 1,244 (at that date it was a new all-time high). By October 30, 2002, it had bottomed out at 899.30 (losing 27% of its value). This marked a nearly 5 month long correction (downtrend). After bottoming out on October 30, 2002, the TSX Venture went on a 16 month rally and peaked out on February 17, 2004 at 1,931.61. This marked a 114% rally from bottom to top over that 16 month period.
The next significant correction occurred from February 17, 2004 through to July 27, 2004. This was when the exchanged collapsed from 1,931.61 to 1,467.59 – a modest correction in comparison to what we are seeing today. Over that 5.5 month period, the TSX Venture lost 24% of its value. However, once it bottomed out on July 27, 2004, it proceeded to go on an 8 month rally and touched 2,040.29 on March 7, 2005. This marked a 39% gain for the TSX Venture in that 8 month period.
The next significant correction was short-lived. The TSX Venture Exchange dropped from 2,040.29 on March 7, 2005 and bottomed out on May 17, 2005 at 1,593.63. This marked a 2 month decline of 22%. It was quite a vicious decline considering how quickly it happened. However, once the correction bottomed out, the TSX Venture went on a monster rally. After bottoming on May 17, 2005 at 1,593.63, the TSX Venture went on a 12 month rally to 3,292.49 (hit May 11, 2006). This marked a gain of 106% in a year.
Following that massive rally, the TSX Venture collapsed from 3,292.49 on May 11, 2006, to 2,322.48 on October 4, 2006. This marked a 5 month decline of 29.5%. However, following that correction, the TSX Venture rallied to all-time highs. It hit 3,369.79 on May 7, 2007. This marked a 7 month gain of 45%.
The next significant correction, after the TSX Venture hit an all-time high, was short and vicious. The TSX Venture went from 3,369.79 on May 7, 2007 to 2,445.23 on August 16, 2007. This marked a 3 month decline of 27.5%. However, following that correction, the TSX Venture rallied to 3,173.64 on November 6, 2007. This marked a 3 month gain of 29.5%.
The next significant correction was the worst any of us have ever seen, but it set up a golden rally for those that stayed at the table and kept buying. After hitting 3,173.64 on November 6, 2007, the TSX Venture went on a 13 month decline and bottomed out at 686 on December 9, 2008. This marked a 78.3% decline over a 13 month period. Great companies with world-class assets were deemed worthless by the market. What a mistake that turned out to be for those selling anywhere near the lows. After the TSX Venture bottomed out, it went on a 27 month rally and hit 2,439.83 on March 4, 2011. This marked a 255% gain in just over 2 years – the greatest rally for any of the major markets in North America during that time period.
The next significant correction for the TSX Venture is the one we currently find ourselves in. Although there was a short-lived rally at the start of 2012, the downtrend in the TSX Venture has been steady since March 4th of last year. Since hitting 2,439.83 on March 4, 2011, the TSX Venture has collapsed down to as low as 1333 on October 4, 2011 (it has been bumping along the bottom ever since). That marks a 45.5% decline from its March 4th 2011 value. That also marks the 2nd largest drop in the history of this exchange. Now, given that we have been bumping along near the bottom of this collapse for 7 months, one can argue that ‘this time is different’. However, every time a market crash occurs, that argument is brought to the forefront.
Those are the statistics behind the 7 crashes the TSX Venture has experienced in its 11 year existence. Crashes and rallies are a part of its genetic make-up. No one will deny that it’s a boom/bust index and if timed well (doesn’t have to be perfect), it can make investors fantastic returns in very short periods. This is what will keep investors coming back to the TSX Venture – the greed factor. Let’s look at the TSX Venture’s historical averages:
Average loss (in percentage terms) during a correction (peak-to-trough): -36.25%
Average duration of a bear market in the TSX Venture: 5.78 months
Average gain after a correction (trough-to-peak): 98.08%
Average duration of a bull market in TSX Venture: 11.83 months
It can be argued which stage the Venture is in for its boom/bust cycle right now. However, historical statistics are showing us that at these levels, the Venture is looking like a buy. There is no doubt that volatility is going to be around for a long period of time (for all stock exchanges), but that isn’t necessarily a bad thing.
Inflation is good for the value of commodities and the TSX Venture exchange is heavily weighted towards exploration companies. With growth stalling world-wide, global stimulus is inevitable in my opinion. QE3 will come in one form or another. Japan is already adding to its stimulus programs. The ECB has stated that more easing is needed and China is weighing options for further stimulus as well. With the UK officially entering a double-dip recession, it’s likely to continue printing. This is all good news for commodity based investment.
Let’s not forget about what tax season can do for smaller, illiquid stocks (ones that trade on the Venture). It’s often overlooked, but the end of April is when personal income tax is due. Quite often at this time of year you’ll see more pressure on the smaller exchanges because individuals need to cover tax burdens. Individuals (specifically the self-employed) are scrounging up some extra cash to pay the tax man right now.
Another bullish point to consider is that we are approaching drilling season for many explorers. Companies have either started drilling or will be soon thanks to the warmer weather and all the money raised over the past 18 months (which were strong periods for financings).
Drill results are coming…new discoveries are a guarantee in the next 3 months. The advantage for people like us is that we can get in before these results are produced; and we can do so for nearly 50% cheaper than 12 months ago.
An interesting statistic I found on the TSX website (TMX.com) was that “total financings raised in March 2012 was up 182% compared to February 2012 [for the TSX Venture].”
Could this be a sign that the smart money believes a bottom in the Venture has been established?
Rick Rule, one of the most successful junior resource investors on the planet, recently wrote an article titled “Why I’m Excited About This Gold Market”.
Rick stated “As experienced junior gold speculators know, nothing adds to share value like discovery. Speculators will fondly remember hundredfold profits from discoveries like Diamond Fields and Arequipa. We are now truly in a discovery cycle, one fueled by sustained capital investments in unprecedented amounts. Better yet, we have been able to explore frontier terrain that was off limits due to politics or social turmoil. This will add spectacular real value, and this prospectivity is discounted in the current market.”
He goes on to state “First, recognize that markets work, but only in the longer term. If you can’t handle that, find another avocation. The cure for low prices is low prices; the cure for high prices is high prices. In order to sell high, you must buy low. What is the appropriate response to a strong market? Sell! What is the appropriate response to a weak market? Buy! Be a contrarian or be a victim.”
As Rahm Emanuel said “A crisis is a terrible thing to waste.”
thx Jon… sorry seems I didnt do my homework:(
Tony … 2 years ago I said that the ventures trajectory was similar to the drop to 700’s…. we may find support in that area… if the market isnt broken outright….
much fear right now for sure….
Well the critical support at 860 didn’t hold, so where do we
go now ? The Venture is like pee–g in the snow, there’s
a bottom down there somewhere.
Jon, one question. Why do you think GGI hasn’t drilled the Grizzly yet?
With 262 sq. km, Dan, they’ve got a very large number of potential targets and I’m sure the recent results from DBV and PGX are likely being scrutinized carefully to both eliminate certain targets and expand others. If they hadn’t taken the time to line up targets at Rodadero in the right way, they never would have hit on 5 out of the first 6 holes. As a shareholder I want to see them hit on the first hole at the Grizzly. Let’s wait for an update from GGI and see what they have to say and where they’re at.
As I said the other day. We will come close to the 2008 low and do a double bottom in the charts. Any chart reader can see whats coming.
Bert
excellent article
thanks for sharing
Dave. So if the venture does double bottom. Do u expect it to bounce? I guess that would be the million dollar question wouldn’t it
JON: where is the cash/share on PGX? I know they have money left….
I’m not 100% sure, Steven, but I would predict about 3 cents or less based on the last statement…there are a host of issues here, this is not about “bad” results from the Star target…if anything, the market IMHO has expressed extreme disappointment that the first 19 holes were all drilled over a relatively confined area within a known deposit (the Star), not what PGX stated it was going to do…you add that to weaknesses on the communications/PR side, and a challenging overall market of course, and you have a giant mess…this is very unfortunate and the extent of this was avoidable IMHO…
I wonder if the award winning Geo for pgx is going to win it again this year?
DBV MOVING!
And so it should, Steven…yesterday’s action was encouraging as the weakness came on low volume…strong holders here, and a growing deposit. We’re in turbulent markets so there’s going to be volatility here, but Farshad will find a way to move forward…
Tony T
If this keeps up, there may not be a Venture exchange,
alone award winning CEO’s… Talk about market fear,
it is happening on a computer right in front of you.
Oh well, i am hanging in there. I see RBW is going
into the DSO business.
More $$ in the coffers (albeit long term) for FNC without diluting its shareholders;
Fancamp signs final deal to sell Que. claims to Uragold
Check on Stockwatch website
For some reason link didn’t post on latest Fancamp NR;