Gold has traded between $1,189 and $1,204 so far today…as of 7:20 am Pacific, bullion is up $1 an ounce at $1,199…Silver has climbed 18 cents to $16.65…Copper is off a penny at $3.03…Crude Oil is 60 cents higher at $76.38 while the U.S. Dollar Index has slipped nearly one-fifth of a point to 88.01…

Commercial traders significantly raised their net-short positions in Gold for the week ending November 18, according to the latest Commodity Futures Trading Commission data…managed-money traders returned as Gold buyers following 3 weeks of cutting bullish positions…
China’s net Gold imports from Hong Kong rose to 77.628 tonnes in October from 68.641 tonnes in September, as the world’s biggest consumer saw strong demand for jewellery and bars…
Mineweb’s Lawrence Williams estimated in an article this morning (www.mineweb.com) that China’s total Gold demand this year will come in around 2,100 tonnes. “If the figure of 2,100 tonnes is indeed reached it will mean that Chinese Gold demand in 2014 will only be around 5% down on last year’s record, a far cry from what the mainstream media has been suggesting.
“With Gold withdrawals from the Shanghai Gold Exchange having reached 1,761 tonnes by November 14, and weekly withdrawals since the Golden Week holiday at the beginning of October averaging comfortably over 50 tonnes, China looks to be heading for an annual demand total (SGE Gold withdrawals equate to overall demand) of comfortably over 2,000 tonnes again this year, assuming these levels are maintained,” Williams wrote. “Historically, November and December are strong months for Chinese Gold demand ahead of the Chinese New Year (February 19, 2015) which suggests Gold demand will remain strong through January and the first half of February too.”
Citi Predicts Continued Oil Price Slide If OPEC Doesn’t Act
Analysts in Citi’s commodities research team warn that the shale gas and Oil revolution in the U.S. has been ignored for too long by OPEC which must agree to cut production when it meets on Thursday or else Oil prices “will resume their slide”. In a report published late yesterday, a group of Citi energy analysts also stated, “The reality of the shale revolution in the U.S., long scoffed at from within OPEC as high-cost folly, is now hitting the producer group where it hurts, while Oil demand growth has underperformed significantly. After years of inaction, the shale revolution (has issued) the producer group with a wake-up call, against a weak demand backdrop.”
Oil Price Decline Hits Russia Hard
The Oil price drop, combined with Putin’s aggressive actions in Ukraine that have led to Western sanctions, is costing Russia more than $10 billion a month according to estimates from the country’s finance minister, Anton Siluanov…
Russia relies on Oil and gas for around two-thirds of exports and half of federal budget revenues…over the course of a year, each $1 fall in the Oil price wipes around $1.4 billion off federal tax revenues…Siluanov said in a speech yesterday that falling Oil prices are causing the most damage, leading to $90 billion to $100 billion in annual losses…
Oil On The Rebound?
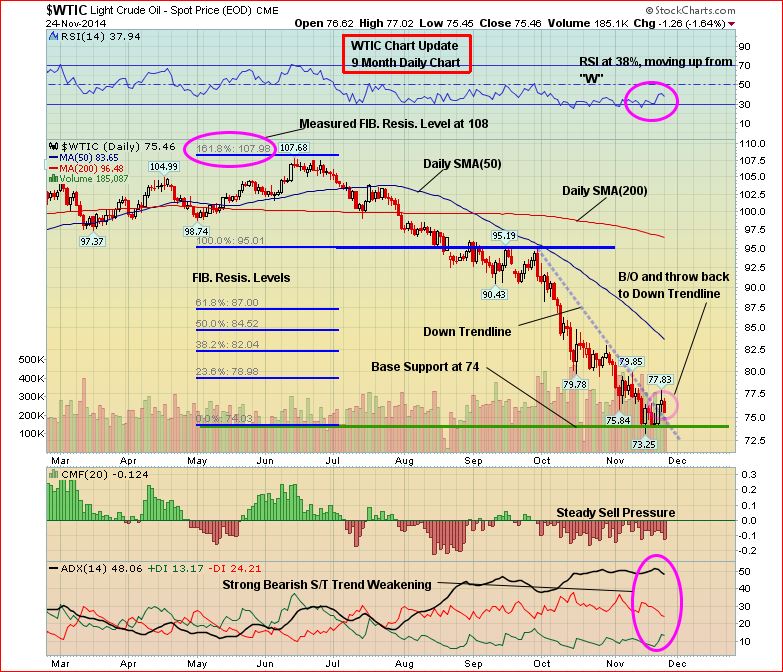
Technically, Crude is giving clues that a rebound in prices is underway…this 9-month daily chart shows WTIC now above a downtrend line in place since the beginning of last month…a pre-Christmas rally into the low $80’s is certainly possible…that’s where the price will meet resistance at the Fib. 38.2% level and the declining 50-day moving average (SMA)…a lot will hinge on Thursday’s OPEC meeting but most of any potential bad news has likely already been priced into the market…key long-term support is at $70 – a drop below that could cause a slide all the way down to the unthinkable $50 area…
Today’s Equity Markets
Asia
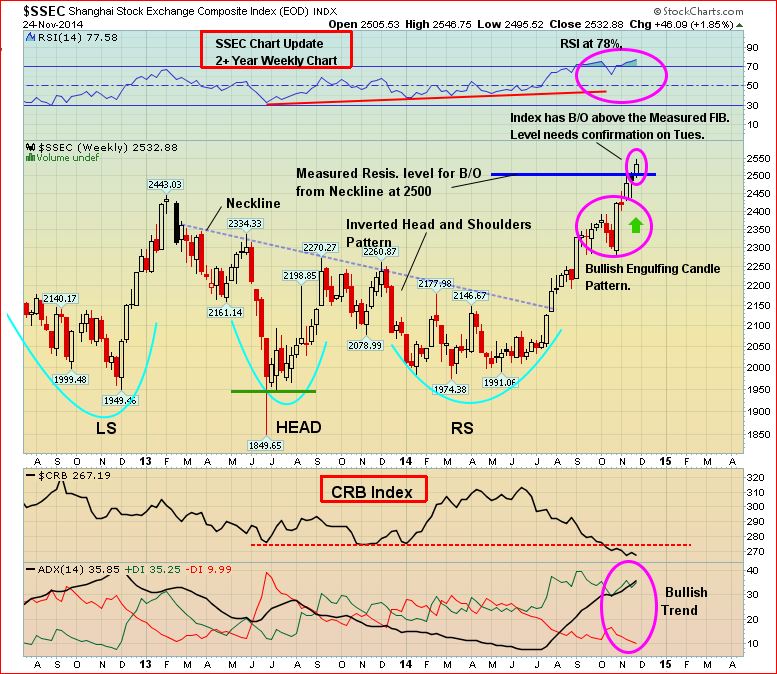
China’s Shanghai Composite roared to a new 3-year high overnight, climbing another 35 points to close at 2568 as investors continued to celebrate the central bank’s rate cut last Friday …what we’re seeing right now is clearly a “melt up” in the Chinese stock market, triggered in large part by fresh new monetary stimulus which traders believe will lower downside risks to the economy…
Importantly, as you can see in John’s 2+ year weekly chart, the Shanghai has broken out above resistance at 2500 which means momentum is on its side going into the balance of the year…this is probably bullish for global equities in general…central banks are the market’s best friend at the moment…
Europe
European markets are up modestly in late trading overseas…
North America
The Dow is off 26 points points through the first 50 minutes of trading…the Consumer Confidence Index for November came in weaker than expected…however, earlier this morning it was reported that U.S. GDP growth in the third quarter was stronger than previously estimated, showing the economy has some resilience in the face of increasing global uncertainty…GDP grew at a seasonally adjusted annual rate of 3.9% in the third quarter, the Commerce Department stated this morning…the agency had previously estimated the Q3 growth rate at 3.5%…gains in the past 2 quarters represent the best 6-month stretch of growth since late 2003, if the numbers can be trusted…output grew at a 4.6% pace in the second quarter, following a first-quarter contraction…
The TSX is up 53 points while the Venture has added 2 points to 789 as of 7:20 am Pacific…
CRB Index Updated Chart
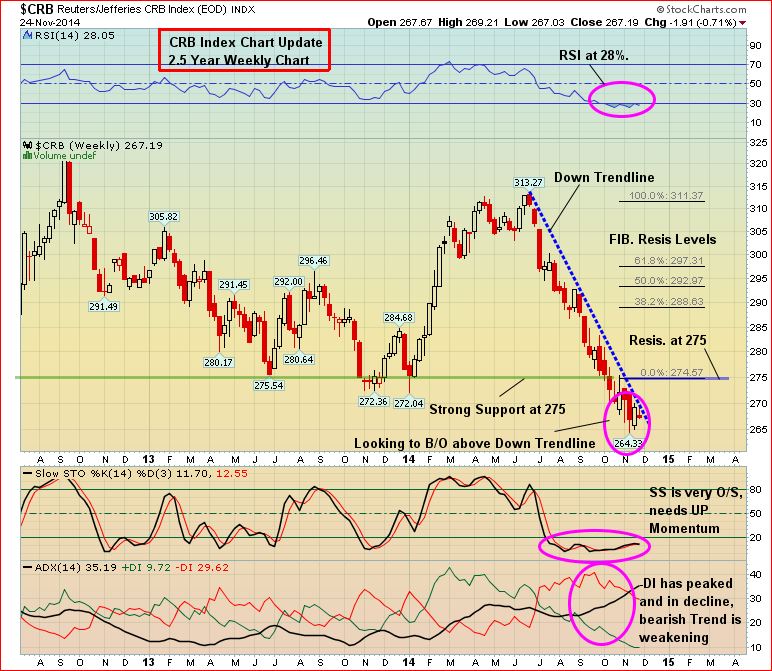
A recovery in the CRB Index, like we saw during the first half of the year, would be tremendously helpful for the Venture…
The bearish trend in the CRB has clearly weakened – the question now is, how soon can it start to gain traction?…the first clue to watch for will be a breakout above the downtrend line in place since the summer…this morning, the Index is right up against that resistance…
Amarc Resources (AHR, TSX-V) Update
Amarc Resources (AHR, TSX-V) should get some increased attention in 2015 after very encouraging results yesterday from an initial 9-hole drill program at the company’s IKE Project in the Cariboo region of British Columbia…AHR has an early-stage bulk-tonnage porphyry Copper-Molybdenum-Silver discovery on its hands in the heart of a producing area as all 9 holes intersected chalcopyrite and molybdenite mineralization from surface and over a broad area measuring 1,200 m east-west by 600 m north-south and to depths of approximately 500 m…
Interval highlights included 247 m grading 0.42% CuEq in IK-14-001; 234 m @ 0.43% CuEq in IK-14-002; and 308 m @ 0.41% CuEq in IK-14-006…yesterday’s results, along with post-drilling geological, geochemical and geophysical surveys completed outward from the drilled area, indicate that the IKE porphyry system has the potential to host a significant resource…
With no immediate follow-up drilling and going into December, however, it’s not the best time for these results to give Amarc a major boost in the market…any weakness in AHR prior to Christmas, though, could prove to be an attractive opportunity for patient investors as this play will no doubt heat up at some point during the first half of next year…
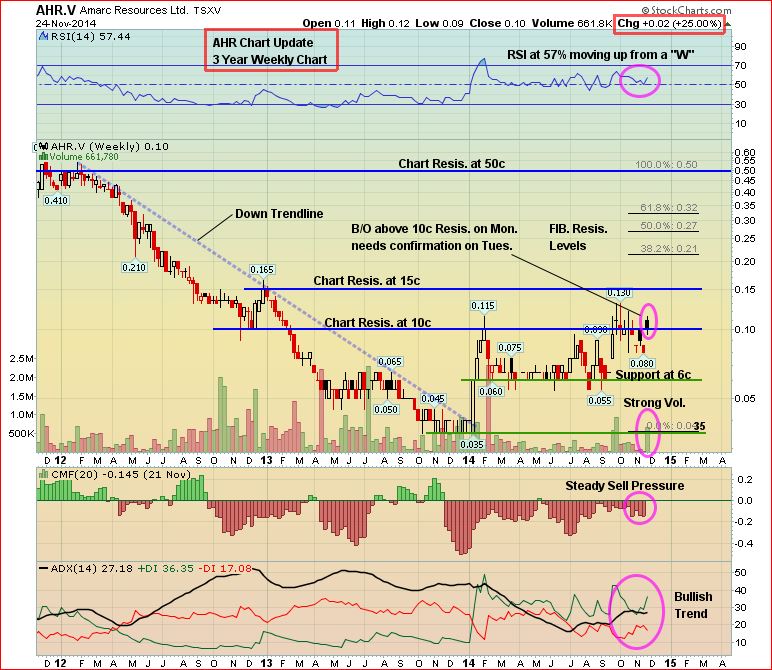
John’s 3-year weekly AHR chart shows an overall bullish trend with excellent support at 6 cents and resistance at 10 cents…
AHR is up half a penny at 10.5 cents on light volume as of 7:20 am Pacific…
Fission Uranium (FCU, TSX) Update
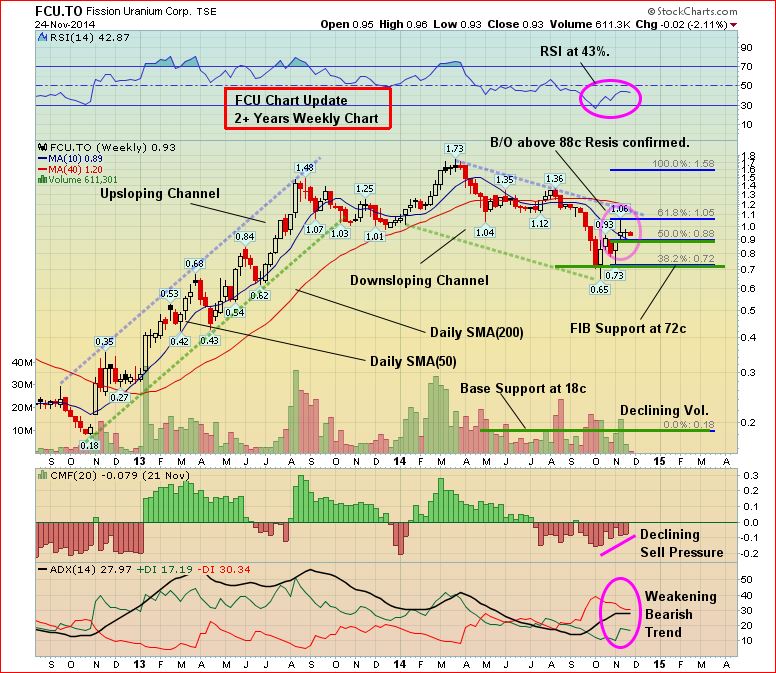
Technically and fundamentally, Fission Uranium (FCU, TSX) continues to look well-positioned for a potential breakout before year-end when the company is expected to release a maiden resource estimate for its PLS Property in Saskatchewan’s Athabasca Basin…Uranium mineralization at PLS has been traced by core drilling over 2.2 km of east-west strike length in 4 separate mineralized zones…mineralization remains open along strike both to the western and eastern extents…this is a world-class discovery, and FCU has been primed for a takeout…
Fission should sparkle if and when there’s a breakout above the downsloping channel in this 2+ year weekly chart…the stock recently overcame Fib. resistance at 88 cents with the next Fib. resistance at $1.05…however, getting above the downsloping channel and the 200-day SMA will be key…
Fission is unchanged at 93 cents as of 7:20 am Pacific…
Interest has certainly picked up in the Uranium sector with renewed strength in the Uranium spot price (it has been climbing steadily since August)…
Adventure Gold Inc. (AGE, TSX-V) Update
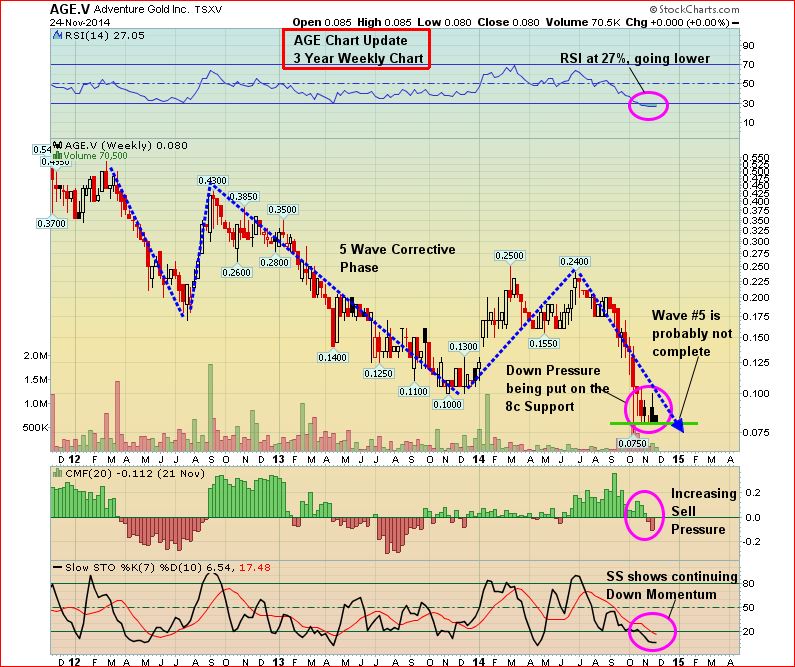
Pre-Christmas bargain hunters should keep a close eye on Adventure Gold (AGE, TSX-V) which has had a rough second half of the year and may have further to fall given current downside momentum…a lot of times this is technically-driven and doesn’t end until extreme oversold conditions have emerged…AGE is still in a healthy financial position ($2.7 million in working capital as of July 31, the latest financials) and has a quality portfolio of properties in the Abitibi region, one of the richest Gold mining areas in the world…
Support at 8 cents is currently being tested – a drop below that level is certainly possible prior to Christmas, and that’s what bargain hunters should be watching for…
Abcourt Mines (ABI, TSX-V) Update
Another one for our readers’ due diligence to potentially stuff into their Christmas stockings, especially in the event of any additional weakness…Abcourt Mines (ABI, TSX-V) is in production with its high-grade Elder Mine near Rouyn-Noranda…the company expects to soon be in full production at 12,500 tonnes per month which equates to around 20,000 ounces of Gold per year…
A breakout in Gold above $1,200 an ounce would certainly be bullish for ABI which is also benefiting from a low Canadian dollar and a significant drop in Oil prices…
Technically, ABI is trading between a long-term support band between 5 and 5.5 cents…it’s also approaching previous RSI(14) support on this 10-year monthly chart…
Note: John, Terry and Jon do not hold share positions in AHR, FCU, AGE or ABI.


6 Comments
RMG had a great news release today too!
ggi looks ready to bust out of a pennant formation. awesome. i’m getting excited.
i wonder if sgc will be the next nsu. probably not but it could be a takeover target as it looks like nsu is about to be taken out.
NGD has been having a great recovery the past couple weeks, do you plan on making any updated charts for them?
Yes, Cam, good point about NGD, we were actually looking at some of the producers again today including NGD. We have a chart tomorrow on the TSX Gold Index and two producers, plus an updated Silver chart as it broke out above a downtrend line today – requires confirmation tomorrow. Silver may have a nice run coming up. Should be a better day tomorrow for the Venture with month-end settlement out of the way.
John… if OIL closes under 74 and thus the trend line the B/O is not confirmed and more downside is probable yes?? TIA