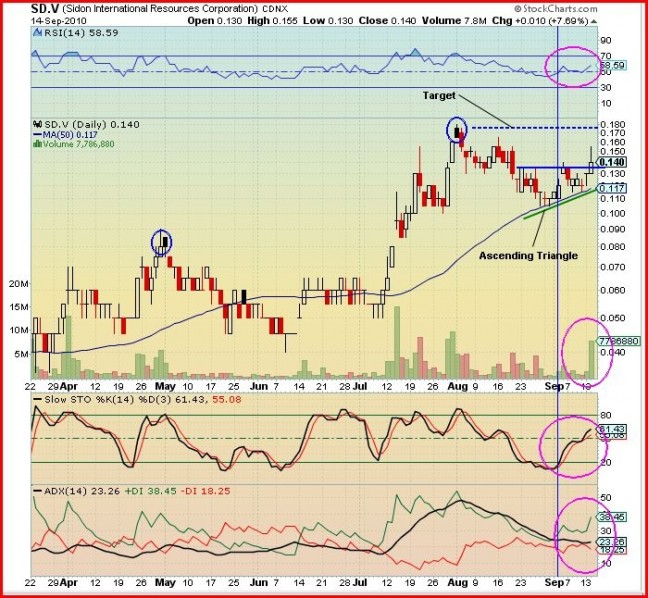
John: Yesterday, Sidon International Resources (SD, TSX-V) opened at 13 cents, its low for the day, then climbed to a high of 15.5 cents and closed at 14 cents – up 1 penny with a whopping 8 million CDNX shares changing hands. This sudden heightened interest was caused by two factors: The price of Gold rose to a new high around $1,276 per ounce, and Canaco Resources (CAN, TSX-V) reported significant new exploration developments at the company’s 100-per-cent-owned Handeni Project located approximately 100 kilometres from Sidon’s Morogoro East Property in Tanzania.
Looking at the 6-month daily chart above, we see that over the last 17 trading sessions Sidon has formed a bullish ascending triangle. The top horizontal line (blue) is resistance at 13.5 cents and the sloping green line is support. Yesterday it broke out and closed above this resistance with the aid of huge volume of nearly 8 million CDNX shares. This must be confirmed by today’s close being higher than 13.5 cents. If this is confirmed, then the 13.5 cent line becomes new support. The next potential price level is calculated by adding the widest part of the triangle (LH side) to the top line (blue). That is 13.5 – 9.5 + 13.5 = 17.5 cents (dotted blue line). Also note the previous high was 18 cents, so some strong resistance in this area (17 to 18 cents) can certainly be expected.
The SMA-50 (blue line) is providing very good support and is pointing up – bullish.
Also note that yesterday’s volume is the highest since the end of July. As a point of interest I have also put mauve circles around 2 black candles. A black candle at the end of a bullish run-up denotes exhaustion. It means that on that day the opening trade gapped up and drifted lower at the close. In otherwords the bears were too strong for the bulls, or the sellers overcame the buying pressure. Usually when a black candle occurs that is the end of the run-up, at least for the near term (which is exactly what we saw with Sidon). That’s not to say Sidon doesn’t have the potential to take out those previous highs – it certainly does.
Looking at the indicators:
The RSI has formed a rather flat bullish “W” formation above 50% and is pointing up – bullish.
The Slow Stochastics %K (black line) crossed up over the %D (red line) below 20% and now is climbing above 50% – bullish.
The ADX trend indicator has the +DI (green line) pointing up and above the -DI (red line) pointing down, and the ADX (black line) trend strength indicator is low but starting to turn up. This shows the trend is weak at the moment, because the stock has been consolidating, but the trend is strengthening.
Outlook: With the strength in Gold and investor interest in Canaco (the area leader) remaining high, Sidon could soon test resistance in the 17 to 18 cent range. The overall technicals are very strong with this stock, showing it has excellent near term and longer term potential.

