TSX Venture Exchange and Gold
It was not a good week for the Venture which was thrown off course by instability around the globe, led by China where authorities really seem to be struggling with how to handle their equity and currency markets in addition to the source of those problems – a pronounced economic slowdown, worse than what they had anticipated. Investors have lost a lot of confidence in China during these first 2 weeks of 2016, given confusing policy signals. It’s a communist regime. Should we be surprised?
The troubles don’t end with China, however. There is an absolutely astounding lack of economic leadership and basic common sense among governments around the world, and we have plenty of examples of that just in Canada and the United States (like him or not, it’s perfectly understandable why Donald Trump keeps climbing in the polls. Americans are fed up with the establishment, and Trump may just take Hillary Clinton to the woodshed to bring real change to Washington).
Meanwhile, does the Federal Reserve really know what it’s doing, and what kind of ammunition does it have to fight another potential recession (the U.S. manufacturing sector is already in one)? Amazingly, the Fed has been completely blindsided by the intensity of the Oil price drop and continued deflationary pressures in the economy, so what else do they not see coming? Will the Fed’s credibility take a major hit if Janet Yellen has to backtrack, as seems very possible, on her planned interest rate hikes this year? You bet it will.
Against a very uncertain political and economic backdrop, U.S. equity markets are on a cliff while Gold has firmed. No trading on Monday in the U.S., which is perhaps a blessing, as it’s Martin Luther King, Jr. Day.
Dow Collapse On The Way?
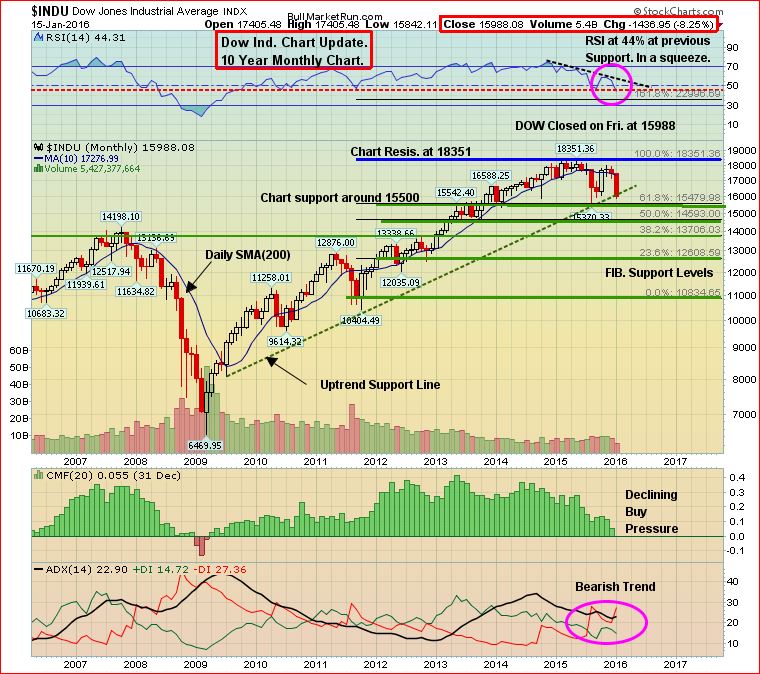
Usually we begin with a Venture chart but today it’s important to examine how close the Dow is to literally falling off the cliff.
When Crude Oil broke below a long-term uptrend line in late 2014, we sounded the alarm with regard to WTIC.
As you’ll see in the 10-year monthly chart below, risks in the Dow have increased significantly with Friday’s close below the uptrend support (red dotted line). RSI(14) has also landed at critical support (44%) which has held since 2009. The risk factor is particularly high right now because buy pressure (CMF) is in its sharpest decline since just before the 2008 Crash. In addition, the ADX indicator is showing an increasingly bearish trend while the 200-day moving average (SMA), not shown on this chart, has started to reverse to the downside. Momentum is not in the Dow’s favor, which increases the odds of the index getting smacked. A 2,000+ point drop certainly can’t be ruled out which would take the Dow to Fib. support around 13700.
In short, this doesn’t have a good feel to it when one combines the Dow’s weak technical posture with the disturbing macro economic/political picture. The possibility clearly exists for a sudden, dramatic plunge in the Dow. The VIX (Volatility Index) is above 25, which is a red flag, while China’s Shanghai Composite is on thin ice right now, too.
Markets may give the Fed a major wake-up call just in time for its January 26–27 meeting.
Venture 6-Month Daily Chart
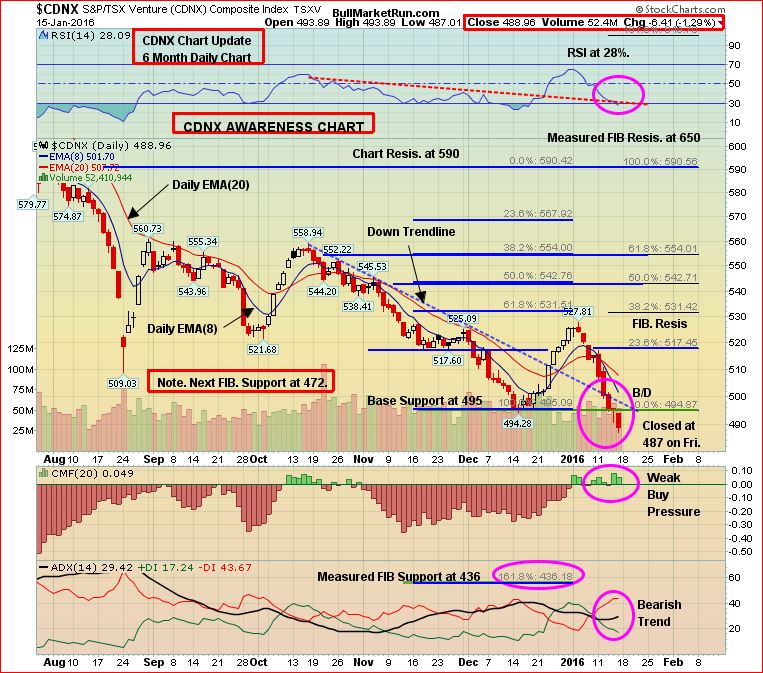
One encouraging aspect to how the Venture has traded over the last 3-and-a-half months is its outperformance vs. such markets as the CRB, Oil, Copper, the Canadian dollar and the TSX. The Venture has proven to be a reliable leading indicator, so it may be telling us that there are better days ahead in the not-too-distant future after the broader indices throw a major temper tantrum. Down 80% from its 2011 high, and now outperforming certain key markets, the Venture seems to have mostly discounted the apocalypse. However, it’s of course highly susceptible to being dragged down even further in the event of a Wall Street meltdown, though quality companies with strong exposure to Gold will at least hold up better and recover more quickly, if they don’t in fact buck the trend.
The Venture hit a new all-time low last week and closed at 489, a loss of 27 points or 5.2% as the Dow finished below 16000 for the first time since last August while Crude Oil plunged 10% for the 2nd straight week.
Last weekend we stated, “If an uptrend has any traction to it in the early stages, the short-term moving averages will typically provide support and continue to rise. That’s something to watch for this coming week. The Venture’s 20-day SMA…is currently 512 and climbing. Can that continue?”
The Venture tripped below 512 on Monday and it was downhill from there for the rest of the week. Interestingly, buy pressure actually picked up a little bit last week, so bargain-hunters are sniffing around. If the Index doesn’t immediately reclaim 495 support, then the Fib. 472 level will be tested.
In the event Wall Street “flips out”, stay calm, cool and collected. The only time it makes sense to get fearful is when the market gets very greedy.
The Seeds Have Been Planted (And Continue To Be Planted) For The Next Big Run In Gold Stocks
There’s no better cure for low prices than low prices. The great benefit of the collapse in Gold prices in 2013, and last summer’s fresh weakness with the drop below $1,100, is that it has forced producers to become much more lean in terms of their cost structures. Producers, big and small, continue to make hard decisions in terms of costs, projects, and rationalizing their overall operations. Exploration budgets among both producers and juniors have also been cut sharply. In addition, government policies across much of the globe are making it more difficult (sometimes impossible) for mining companies to carry out exploration or put Gold (or other) deposits into production, thanks to the ignorance of many politicians and the impact of radical and vocal environmentalists (technology has made it easier for groups opposing mining projects to organize and disseminate information, even in remote areas around the globe). Ultimately, all of these factors are going to eventually create a supply problem and therefore historic opportunities in Gold and quality Gold stocks. Think about it, where are the next major Gold deposits going to come from? On top of that, grades have fallen significantly just over the past decade.
Keep in mind, as well, that in currencies other than the U.S. dollar, Gold has been performing exceedingly well. So don’t get fooled by the widespread negativity in the American media toward Gold at the moment. Bullion in Canadian dollars, for example, is in a major bull phase and certain high-quality Canadian Gold producers have given investors tremendous returns over the past year or two – and still represent great value.
U.S. Dollar Index Updated Chart
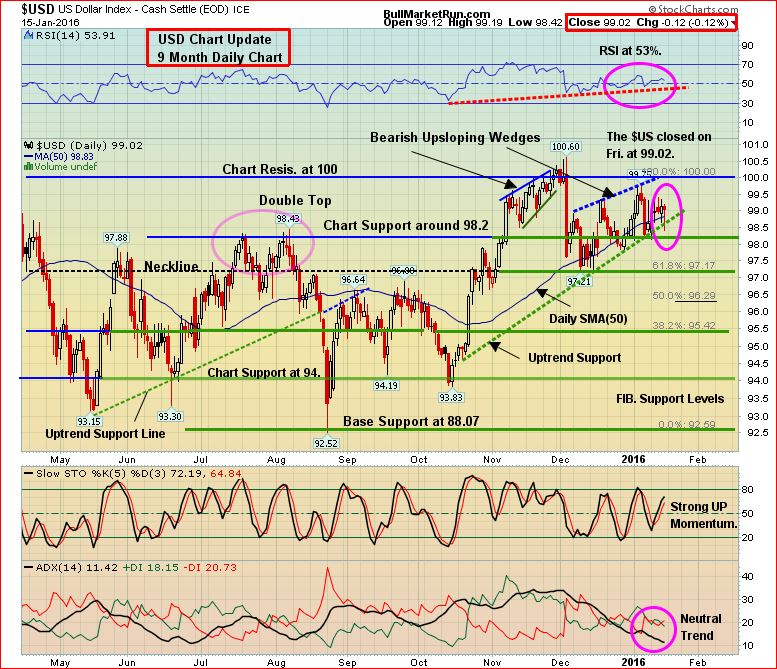
We still believe the path of least resistance for the Dollar Index this quarter is down, especially after the Fed finally pulled the trigger on a rate hike last month (the dollar ran up for 18 months on that speculation). Furthermore, the Fed is in a fantasy world if it thinks it can carry out 4 interest rate hikes in 2016, given the Obama economy, global instability and the lessons of recent history: In the last 7+ years since the world’s central banks responded to the financial crisis by slashing interest rates, more than a dozen banks in the advanced world have tried to raise them again and all have been forced to retreat.
The greenback has shown some resilience over the last several weeks but we rank the odds of a breakdown higher than a breakout above 100. A significant consolidation in the Dollar Index is overdue after a record run, and this would be helpful for Gold while giving commodities in general some relief.
Gold
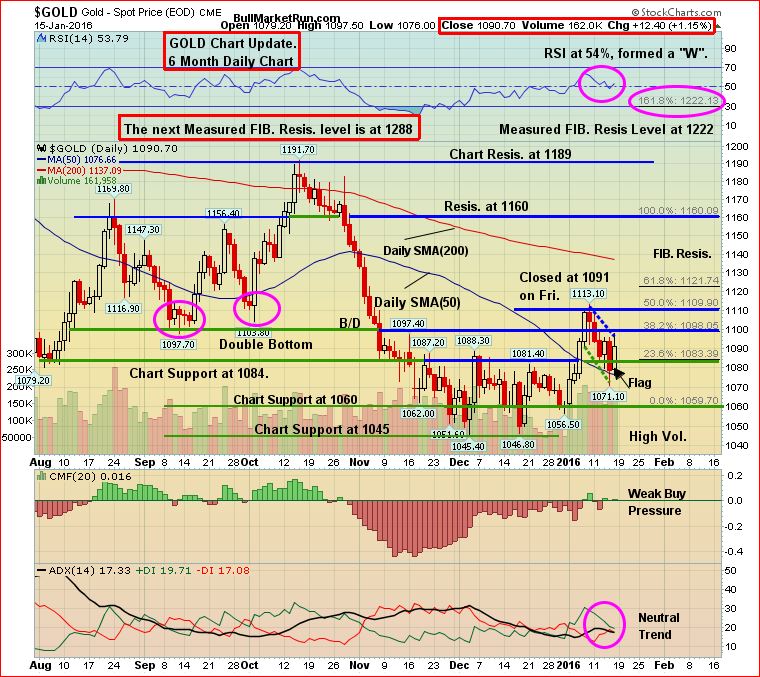
Gold has had a good start to 2016 and it was encouraging to see Friday’s recovery back above key support at $1,080 after Thursday’s intra-day low around $1,070. For the week, Gold was down $16 to close at $1,089 following the previous week’s jump of $45. A minor pullback was expected after that strong first week of January.
Bullion in 2015 posted its 3rd straight annual loss in U.S. Dollar terms for the first time since 1998. However, support for the metal is exceptionally strong within 1.5% to 5% of where it closed for 2015 ($1,061), and during Q4 the smart-money commercial traders positioned themselves for a robust rally. Sell pressure peaked in November while RSI(14) has been in an uptrend since then.
As we maintained late last year, any surprises in Gold are likely to be to the upside in Q1 given the pervasive negative sentiment surrounding the metal. Physical demand out of China should also be strong this month thanks to the upcoming Chinese New Year – a key driver for Gold’s Love trade – falling on February 8. And unlike last year at this time, when they were chasing equities, many Chinese investors will likely be more inclined to invest in Gold given how China’s leadership has seriously shaken the confidence of investors throughout the world in that country’s equity markets.
The near-term Fib. resistance levels for Gold are roughly at $10 intervals from $1,100 to $1,130.
Gold has formed a potentially bullish flag, the bottom of which is supported by its 50-day SMA ($1,077) which imminently could reverse to the upside. RSI(14) retraced to support at 50% last week while also forming a bullish “W”.
Through the first 2 weeks of this year, there has been strength in Gold and Gold stocks when equity markets in general have been under pressure. That trend will likely continue, though one cannot rule out the possibility of a temporary drop in bullion in the event of a global liquidity squeeze event as witnessed during the 2008 Crash.
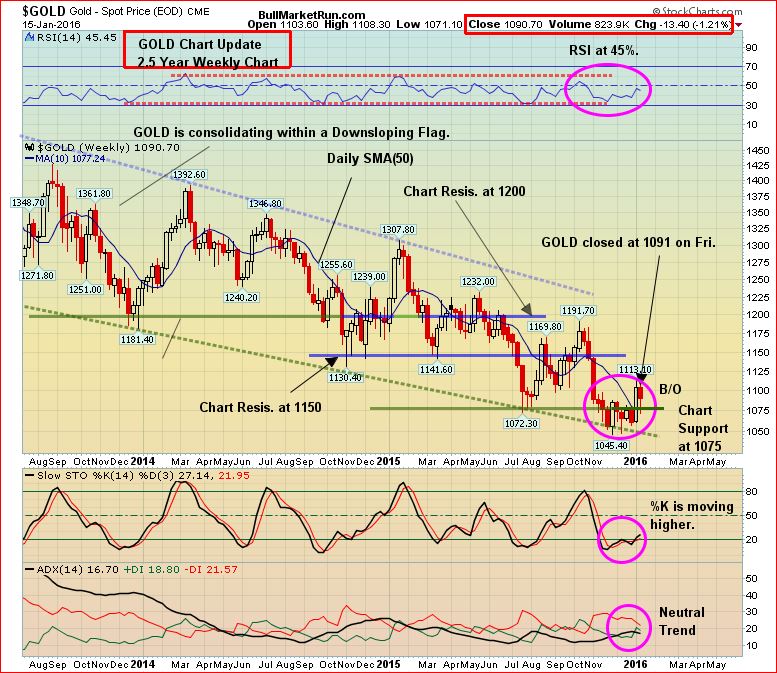
Gold 2.5-Year Weekly Chart
This chart from John has been an amazingly accurate guide for the direction of Gold over the past 2+ years. Each time the yellow metal has hit the bottom of the channel, it has bounced back vigorously which is why we turned bullish on bullion in November and recommended going long on the HGU (double long Gold stock ETF) around $3 ($15 post-consolidation) at the time (it closed Friday at $16.73).
All indicators (RSI-14, SS, ADX) on this chart are well-positioned to support a further climb in Gold this quarter to at least major resistance at $1,150. Where Gold goes from there is anyone’s guess at this point. The top of the channel right now is around $1,200, so any breakout above that level would be extremely significant.
Silver was relatively unchanged last week, closing at $13.91. Copper tumbled 7 cents to $1.96. Crude Oil lost another $3.46 a barrel to finish at $29.70 while the U.S. Dollar Index gained half a point to 98.94.
The “Big Picture” View Of Gold
As Frank Holmes so effectively illustrates at www.usfunds.com, the long-term bull market in Gold has been driven by both the Fear Trade and the Love Trade. The transfer of wealth from west to east, and the accumulation of wealth particularly in China and India, has had a huge impact on bullion and will continue to support prices. Despite Gold’s largest annual drop in 3 decades in 2013, and current weakness, the fundamental long-term case for the metal remains solidly intact based on the following factors (not necessarily in order of importance):
- Growing geopolitical tensions, fueled in part by the ISIS and al Qaeda, and a highly dangerous and expansionist Russia under Vladimir Putin, have put world security in the most precarious state since World War II;
- Weak leadership in the United States and Europe is emboldening enemies of the West;
- Currency instability and an overall lack of confidence in fiat currencies;
- Historically low interest rates/highly accommodating central banks around the world;
- Continued solid accumulation of Gold by China which intends to back up its currency with bullion;
- Massive government debt from the United States to Europe – a “day of reckoning” will come;
- Continued net buying of Gold by central banks around the world;
- Mine closings, a sharp reduction in exploration and a lack of major new discoveries – these factors should contribute to a noticeable tightening of supply over the next couple of years.
