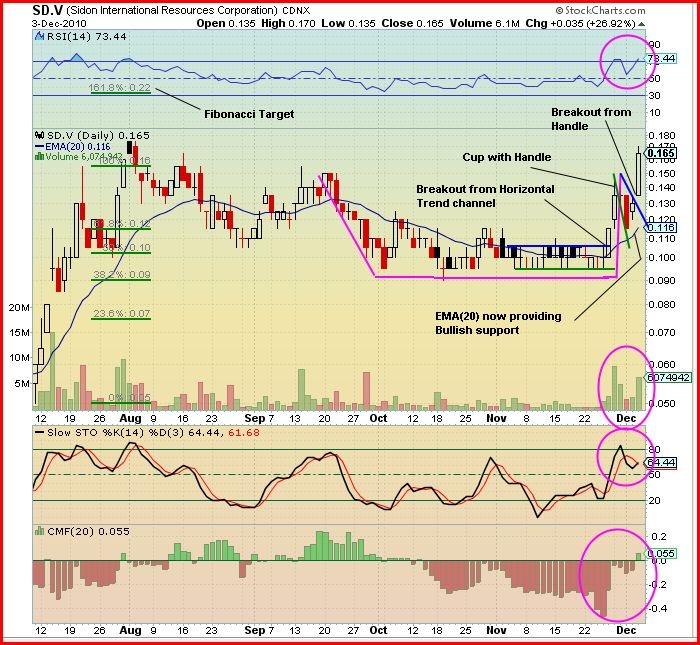
John: On Friday, Sidon International Resources (SD, TSX-V) opened at 13.5 cents, its low, rose to a high of 17 cents and then closed at 16.5 cents for a gain of 3.5 cents or 27% on CDNX volume of 6.1 million shares.
Looking at the 5-month chart below, we see that there has been considerable change from the situation compared to November 25 at which time the price was in a thin horizontal trend channel between 9.5 cents and 10.5 cents:
On Nov. 26 the price broke to the upside and during the next 2 days Sidon rose to the 15 cent level to form a “Cup” pattern (mauve lines). Then the handle formed and on Friday the price broke to the upside again on very high volume. The next resistance level is at 18 cents and the Fibonacci target is shown as 22 cents (this is not a BMR price target as we don’t give price targets but a theoretical near-term Fibonacci target based on technical analysis as a guide for investors).
The price is now above the EMA(20) which is providing bullish support (the 50-day SMA, not noted on the chart, has reversed and is now moving up which is another bullish development). Note how the volume decreased during the handle formation but had a huge increase on the breakout – very bullish.
Looking at the indicators:
The RSI unwound from a slight overbought condition during the handle formation and is now at 73% with plenty of room to continue to move up.
The Slow Stochastics %K (black line) has turned up at 64% and has just crossed above the %D (red line) at 62% – very bullish.
The Chaikin Money Flow (CMF) indicator has moved above zero into the green, thus the buying pressure is increasing.
Outlook: The near-term outlook for Sidon, based on the technical patterns noted above, is very bullish. This supports the improved fundamentals as the company begins a drill program at its Morogoro East Gold Property in Tanzania.
Note: The writer holds a position in Sidon International Resources.

