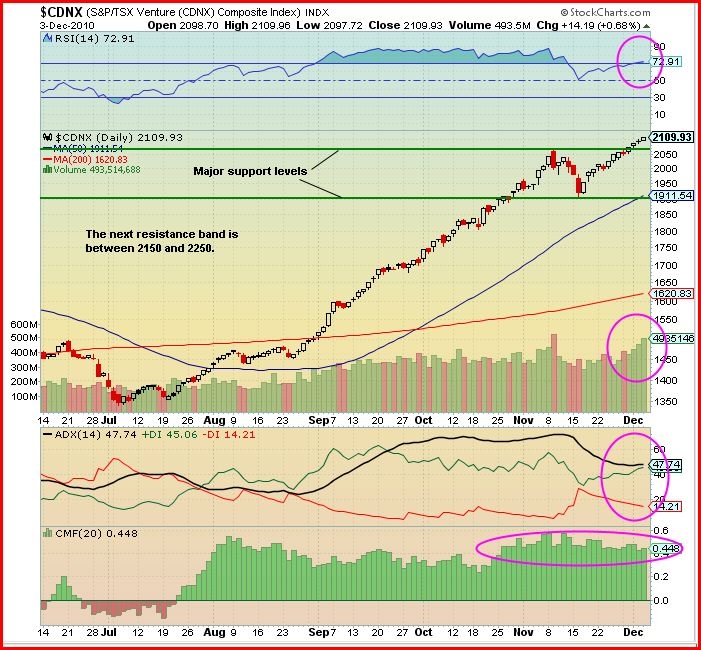
The CDNX is strong again this morning, ahead 12 points at 2122 as of 9:55 am Pacific even though Gold has backed off somewhat after trading as high as $1,422. Everything continues to look very positive, technically, with the CDNX. John’s quick chart update below is based on Friday’s close.
On Friday the CDNX opened at 2099, dropped slightly to 2098 and then rose and closed at a high of 2110 for a gain of 14 points on volume of 404 million shares.
Looking at the chart we see that the CDNX continues its merry climb toward the next resistance band at 2150 – 2250. This is not major resistance and should only cause the Index to pause for a few days at the most. Two very significant support levels are shown at 1910 and 2060.
The SMA(50) daily moving average is providing bullish support and the Index is not too far above this moving average to be unstable. The daily volume continues to climb.
Looking at the indicators:
The RSI is pointing up at 73% and could move up as high as 88% before becoming too overbought. The ADX trend indicator has the +DI (green line) at 46, above the -DI (red line) and pointing up. The ADX trend strength indicator (black line) is flat at 48, indicating a steady bullish trend. The Chaikin Money Flow (CMF) indicator shows there has been strong buying pressure since October 25, even during the corrective mode – very bullish.
Outlook: This is an extremely bullish market and we see the potential for 3000 on the CDNX within the first few months of next year as we’ve already outlined in detail. Near-term, there’s a relatively weak resistance band between 2150 and 2250.


1 Comment
i was wondering jon, do you think we will see some sort of pull back and then perhaps another big surge forward with gold and precious metals in the next few days or week? Some consolidation and then new record highs?
alec