Over the past few weeks we’ve outlined the bullish fundamentals that are driving Cadillac Mining (CQX, TSX-V) which today surged to a new 52-week high of 50 cents. During our upcoming visit to Rouyn-Noranda in northwestern Quebec, we’ll be reviewing those fundamentals in more detail in addition of course to covering Gold Bullion Development (GBB, TSX-V) and other interesting opportunities along the infamous Cadillac Trend. Tonight, John takes a look at the near-term technical outlook for Cadillac Mining:
John: Today, Cadillac Mining opened at 41 cents, hit a low of 40 cents and then moved to a new 52-week high of 50 cents before settling back and closing at 47 cents for a gain of 5.5 cents (13.25%) on CDNX volume of 540,000 shares. This was a particularly strong move considering the price of Gold tumbled $34 to close at $1381 and the CDNX fell for the first time in 11 sessions.
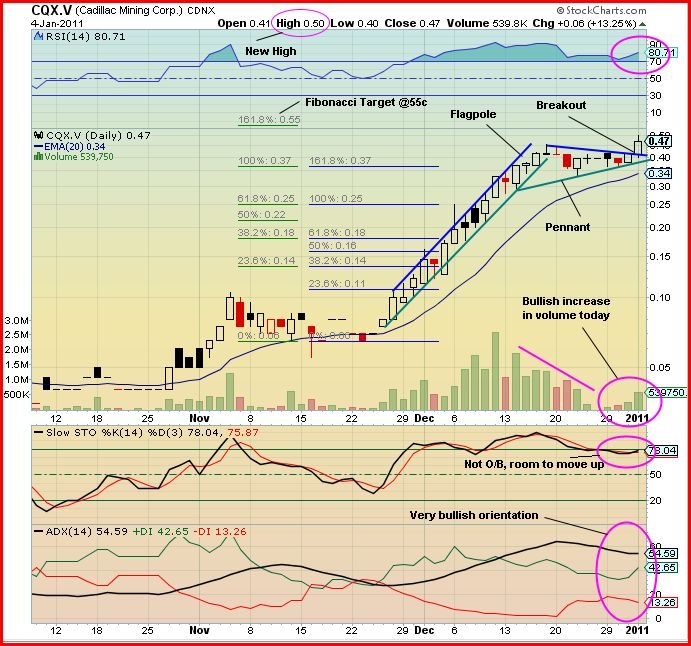
Looking at the 3-month daily chart we see that the “flagpole” started on November 25, 2010, and CQX proceeded to climb in price with increasing average daily volume until a peak of 45.5 cents was reached on December 17. For the following 8 sessions the price consolidated in a pennant pattern with decreasing average daily volume until today when we saw a breakout to 50 cents with the volume increasing to 540,000 shares.
The close supporting EMA-20 (blue line) is at 34 cents. The blue Fibonacci set shows the “seed” wave spanning from 6 cents to 25 cents with the first Fibonacci target of 37 cents. This closely agrees with the base support level of the pennant. The green Fibonacci set shows the next immediate Fibonacci target level (there are higher levels as shown in our pre-Christmas update) is 55 cents (this is not a BMR price target as we don’t give price targets but merely a theoretical Fibonacci level based on technical analysis).
Looking at the indicators:
The RSI, while still overbought at 81%, still has room to move up to the previous overbought level of 92% – bullish.
The Slow Stochastics has the %K (black line) above the %D (red line) at 78% and 75%, respectively, and has plenty of room to move higher without becoming extreme – bullish.
The ADX trend indicator has the +DI (green line) pointing up at 43 and above the -DI (red line) at 13. The ADX trend strength (black line) indicator is high and steady at 55. All indicators are in bullish orientation.
Outlook: Cadillac showed impressive new strength today and appears to be entrenched in a firm uptrend.
Note: The writer holds a position in Cadillac Mining.


4 Comments
John, I take it that the pre-Xmas Fibonacci targets for CQX (71 cents) and GBB ($1.09)are still valid and in place? I know “these are not BMR price targets but merely theoretical Fibonacci levels based on technical analysis”. Thanks for your great and helpful work along with Jon and thanks to Terry also.
Yes they are.
Has anyone done research of Midlands Minerals (MEX)? They just aquired 600 sq km of land near Hendini in Tanzania and they also hold properties in the Lake Victoria region in Tanzania. They are currently exploring in Ghana for > 1 Moz’s. Stock hasn’t done much lately. Highly prospective?
PPI is HOT today. You may want to take a look at this one! All the best with your investing. Many blessings. Terry