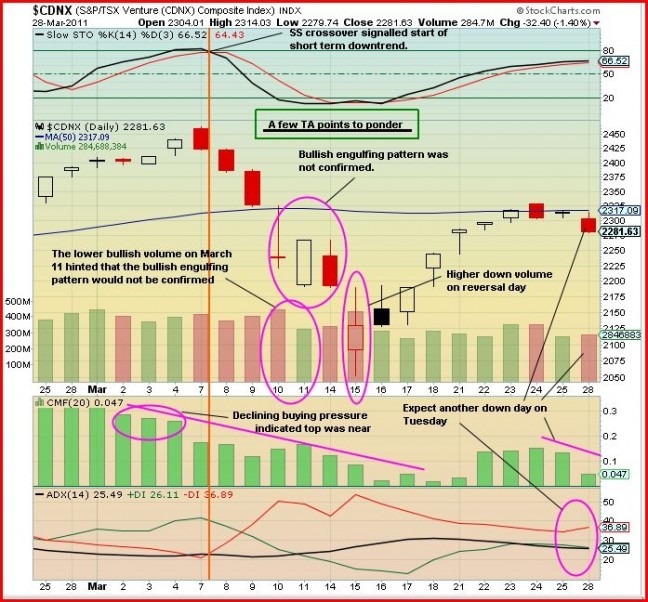
John: Usually at BMR when we present a chart of a company’s trading or of an Index we are trying to identify a major move. This may be a price reversal, a breakout from a consolidation or a reversal of trend. Technical analysis (TA) does not recommend guessing that a breakout from a triangle will be to the upside or the pattern in progress will be a head and shoulders that will be completed in the near future. TA waits for the pattern to be completed and meet all the requirements for confirmation. That does not mean the investor cannot be made aware of the probabilities and be prepared for when the confirmation occurs, thus having a chance to maximize profits or minimize losses.
Tonight I’m presenting a 1-month daily chart of the CDNX to point out a few of the TA indicators that are not always obvious to the average investor.
First, let us look at the run-up in February and March on the left hand side. On Feb. 25 there was a strong white shaved top candle with heavy upside volume and high buying pressure. This was followed by 3 doji candles (indecision) which should make the investor instantly aware that there is indecision in the trading, especially with 3 in succession. The third doji on March 1 gave the first indication that weakness was entering this market. Not because of the red candle (body of the doji is so small) but because there was a slight drop in volume plus a drop in buying pressure. This was followed by a gallant attack by the bulls with 2 white candles but with lower volumes and declining buying pressure – a clear indication of weakness in the near-term uptrend. Then, on March 7, the CDNX gapped up at the open but declined during the day, creating a red candle. This was an exhaustion gap signaling that the short-term uptrend was at an end. The volume was high and the buying pressure significantly lower than the previous session.
The short-term downtrend started on March 7 and was followed by 3 more red candles, each with increasing volume but with decreasing buying pressure (on March 10 we warned of a potential 20% correction in the CDNX). Nothing here indicated when it would end. The next session on March11 gapped down at the open and climbed during the day to close at its high. Did this strong move indicate a reversal? The bullish engulfing chart pattern suggested this was possible but TA requires this pattern to be confirmed by a white candle, a large gap up or a higher close the following day. On the surface this looked like a textbook bullish engulfing but note the lower volume. Even though the buying pressure increased over the previous day the volume was not there. Higher volume is critical. The third day was a red candle, thus the bullish engulfing pattern was not confirmed. This demonstrates how critical it is not to assume and to wait patiently for confirmation.
On March 15 the Index gapped sharply down at the open, dropped to a support level and then rose during the day to create a clear candle. This day had high volume indicating the possibility of a sell-off and reversal. This was confirmed over the next 2 trading sessions, and a rally ensued that took the CDNX to an intra-day high of 2328 March 24.
Looking at today’s action, the combination of the red candle, a small increase in volume, declining buying pressure and an increase in -DI (red line) all point to a down day tomorrow. The risk of a 3-wave correction and a drop to 1850 in the coming weeks cannot yet be ruled out – it remains a distinct possibility. This analysis shows that by reading the interactions of patterns, candles, volume and indicators you can be made aware of the probability of major moves and trend changes and be prepared to trade accordingly to maximize your profits or minimize losses.


1 Comment
Well the CDNX may be hanging in there, but my portfolio of junior golds is getting pounded. I’m down 10% over the last 2 trading sessions. If the CDNX does tank, I’m gonna be hurting big time.