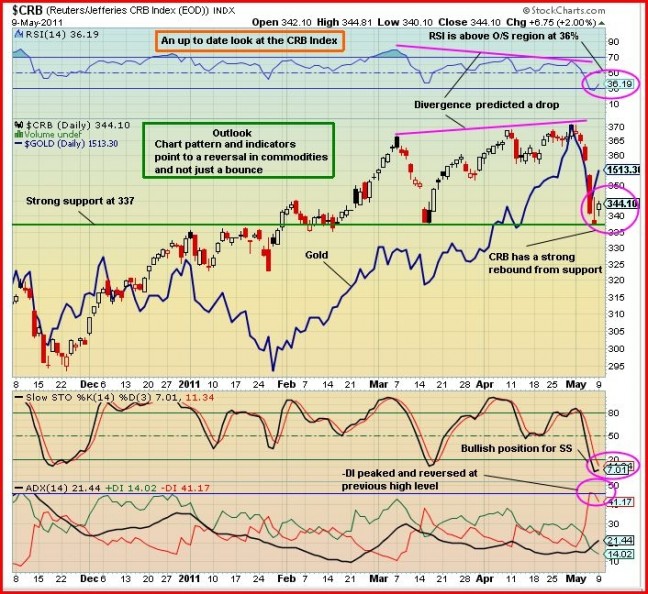
Gold has traded between $1,498 and $1,519 so far today…as of 6:45 am Pacific, the yellow metal is off $3 an ounce at $1,510…Silver continues its rebound after last week’s dramatic sell-off…it’s currently up 42 cents to $38.13…the U.S. Dollar Index is up over one-fifth of a point to 74.83 while crude oil is down $1.08 a barrel to $101.47…the CME Group, the world’s largest commodities exchange, raised margin requirements on crude oil futures contracts by 25% following the market close yesterday in a move designed to curtail excess speculation…this will shake out some of the small single contract players and cause bigger multi-contract players to add funds to their accounts or reduce their positions…crude oil may have a hard time holding $100 and may need to carve out a base in the 90’s before marching higher again…the market will be paying close attention to a slew of Chinese economic data this week including PPI, CPI, industrial production, retail sales, fixed asset investment and international trade statistics…trade data out this morning showed monthly crude imports by the world’s second-largest user rose last month to the third highest volume on record…China’s April crude oil imports increased 1.7% from a year earlier to 5.24 million barrels per day…given last week’s rout in commodities, it’s a good time to examine the technical health of the CRB Index which is an excellent measure of commodity prices and inflation…John’s chart this morning shows the CRB Index hit an important support level last week and more than just a bounce is likely in order…
John: Recently the volatile market action has revolved around commodities. Silver went parabolic and then last week in 5 days collapsed from a high of nearly $50 an ounce to around $33 with other commodities also being affected across the board.
Yesterday, Silver opened at $35.69, fell to a low of $35.27, climbed to a high of $37.94 and then closed at $37.83 for a gain of $2.23 (+6.26%). The question is whether this is a true reversal or just a bounce from an oversold position. Because many commodities also suffered a drop in price it’s appropriate to examine the CRB Index chart. The CRB Index is an unweighted geometric average of important commodities. The Index averages prices across 17 commodities including energy, grains, industrials, livestock, precious metals and agriculturals and across time.
Looking at the 6-month daily CRB Index (EOD) chart, we see that last week the Index collapsed from a high of 370 down to a low of 335. I have included a Gold chart for comparative purposes. The first point to notice is that the down move stopped abruptly at the previous support level of 335 – this indicates just how strong support is at this level. Yesterday the Index gapped up at the open to 342.10, fell to a low of 340.10, rose to a high of 344.81 and then closed at 344.10 for a gain of 6.75 points or 2%. There was a strong indication prior to last week that a correction was possible in part due to Silver’s overbought condition and the divergence between RSI and the CRB Index.
Looking at the Indicators:
The RSI dropped down to just below the 30% level last Friday, putting it in a slightly oversold position. Yesterday it climbed above 30% to 36% – bullish.
The Slow Stochastics (SS) also plunged deep into the oversold region and yesterday the %K reversed direction and appears ready to cross up above the %D and still remain oversold – this is a bullish scenario.
The ADX trend indicator had the -DI reaching a very high level last Friday (horizontal blue line) and yesterday reversed to point down – bullish.
Outlook: The strong bullish position of the chart pattern and the indicators show a high probability that this is a reversal and not just a bounce. The long-term commodities bull market remains completely intact – last week was a correction, not a fundamental shift.
Morning Musings continued…
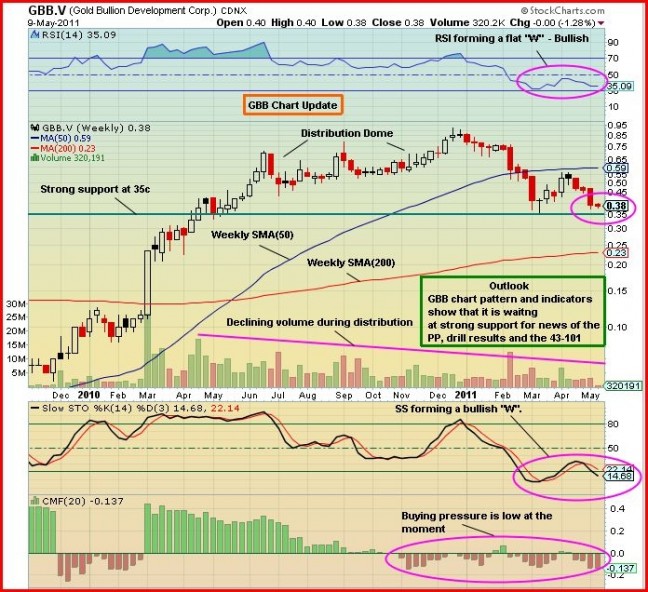
Gold Bullion Development (GBB, TSX-V) has closed its nearly $5 million financing…7,142,770 flow-through shares at 61 cents raised most of the money while 833,333 units at 51 cents (the units include a half warrant) brought in the balance for total gross proceeds of $4.78 million…barring another major market sell-off, we see no reason why GBB won’t hold support at its March low of 34.5 cents…technically, the stock is in oversold territory and everyone knows our position regarding the fundamentals – GBB has an excellent chance of proving up a multi-million ounce deposit at Granada with the initial 43-101 resource estimate expected sometime this summer…GBB closed yesterday at 38.5 cents and as of 6:45 am Pacific, it’ up half a penny at 39 cents…John’s updated GBB chart shows a stock that’s trading in a very strong support zone…
We’ve been paying close attention to Currie Rose Resources (CUI, TSX-V) recently due to very encouraging technical signs and the fact the company is gearing up for the start of a major exploration program in northwest Tanzania…we’ve been waiting for this moment for more than six months since we introduced CUI to our readers – the drilling of the company’s Sekenke Project which we believe is a superb geological target…the ground Currie Rose has locked up in that area is extensive and runs in between and surrounds not just one but two former producing high grade Gold mines…that’s music to the ears of any geologist, especially CUI’s Michael Griffiths who we first spoke to on the matter several months ago…in the exploration business there are never any guarantees but we’ve seen it happen at Granada, Canadian Malartic, Wasamac and elsewhere – many mines from 50 or 100 years ago, and the immediate areas surrounding them, were never properly explored or fully exploited…Currie Rose has an excellent chance for success with its Sekenke Project…this has what they call “blue sky” potential written all over it and we believe the market will respond accordingly…CUI is off half a penny at 16 cents in early trading…Richfield Ventures (RVC, TSX-V), which is up 636% since we introduced it to our readers in December, 2009, released more drill results from its Blackwater Project this morning (the northern section where SilverQuest, SQI, TSX-V, holds a 25% interest) including a stellar hole of 378 metres grading 1.09 g/t Au…SilverQuest is up 6 cents to 78 cents on strong volume while RVC, trading in lockstep with New Gold Inc. (NGD, TSX) is down 2 pennies at $8.83…


5 Comments
the entire spring has seen the gold stocks lag compared to gold surging up. A strange anomaly, but I believe it is due to the tech and coal stocks being hot. I for one have made money on them and many have gotton rich off them. I do believe everything has its cycles. Gold and silver stocks will be the IN thing in late summer early fall. JMHO
I agree David, I think however that QE2 supposed wind-down is the reason for the risk-off and fall in volume. juniors are going to rocket in the next phase. late Summer / Fall is a fair guess and one I would make too
cannacord really loading up on SFF
check out what the ECU CEO said in the latest NR about the going long metals, and short the stocks… interesting read
Jim Sinclair on KWN re-iterating Trader Dan’s point about the Hedge’s being short the miners. Not sure how active these shorts would be in the junior markets – anyone care to comment?
kingworldnews.com/kingworldnews/Broadcast/Broadcast.html