The CDNX is at a potentially pivotal juncture and in the midst of a lot of doom and gloom at the moment (this market is currently down 9.8% for the month and dropped as much as 20.6% over 51 trading sessions March 7 to May 17, a major correction by CDNX historical standards), we’re seeing strong signs that a bottom was put in at 1957 last week and that we’re in the very early stages of a reversal. That’s one interpretation. It’s based on quite powerful technical evidence but we caution it will require confirmation in the days ahead including a move by the CDNX above its 10-day moving average and a reversal to the upside in that SMA. The purpose of this posting is to alert our readers of the possibility of this important reversal in order to prepare for it. We’re working on a list of individual stocks that could be early movers which we’ll post if and when there is confirmation of this new uptrend.
We suggest reading John’s analysis in conjunction with our Saturday article (Week In Review Part 1) for the full context of the current situation.
John: Skeptics of technical analysis (TA) love to portray the TA analyst as a modern day Merlin, complete with white beard and waving a magic wand looking for future stock prices or Index levels. I agree some of us are getting on in years and may have white beards but there are no magic wands. The big mistake TA skeptics make is that they believe TA is for looking into the future. They are wrong because the primary use of TA is to find out what is happening NOW.
Yes, from the results of TA analysis projections are made based on repetitive chart patterns, Elliott wave theories and Fibonacci sets but these are only projected target probabilities and not definitive values. The TA analyst pours over well known chart patterns and indicators that occur time and time again with probable predictable outcomes. They look at the particular history of a certain stock or Index simply to compare what is happening now with historical similar situations to have an “awareness” of the probable result of a particular pattern or situation.
Today we analyze the history of the CDNX with a view to determining what is happening NOW, after the last 3 days’ trading has indicated the possibility of a reversal to the upside. We will consider 2 CDNX charts. Chart #1 is a 10-year monthly chart while Chart #2 is a 3-year weekly chart.
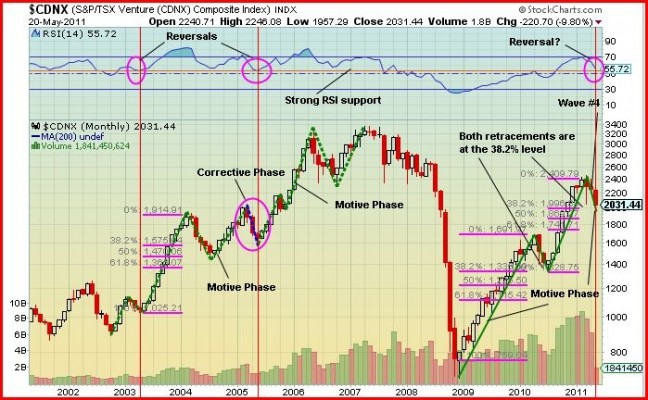
Chart #1: Looking at the 10-year monthly chart, we see that starting in 2002 the CDNX rose from around 900 to approximately 2000 in 2005 in a 5-wave “Motive Phase”. This was followed by a “Corrective Phase” which brought the Index down to the 1600 level.
CDNX Chart #1
Starting in 2005, another 5-wave Motive Phase pushed the Index level to a high of nearly 3400 in 2007. Now consider the RSI(14) indicator. I have shown 2 mauve circles which identify when the RSI fell to the previous support level (orange horizontal line). Each of these points identifies a reversal point. The first one (orange vertical line) shows the reversal from Wave #2 to Wave #3 of the first Motive Phase and the second one identifies the reversal from the Corrective Phase to the start of Wave #1 of the second Motive Phase.
Since the bottom of the 2008 crash the CDNX has moved up in a series of 4 waves of a 3rd Motive Phase. Note that the present monthly RSI value is very close to the RSI(14) historical support level and the daily chart (not presented here) shows the last 3 days’ trading has been to the upside. This alone gives a probable indication that a reversal is taking place.
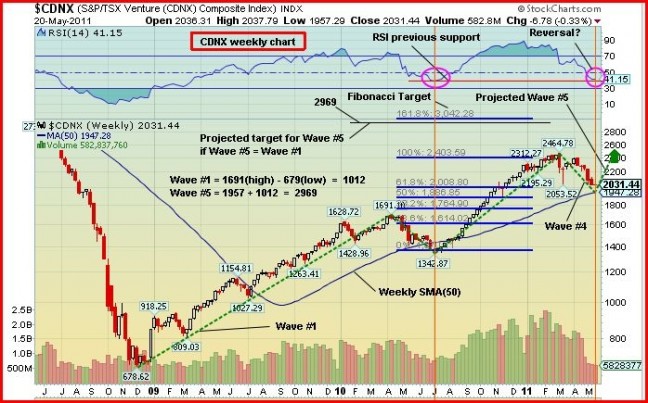
Chart #2: On Chart #2 we see that the Wave #4 is a 38.2% retracement of Wave #3, the same as Wave #2 is of Wave #1. If this is indeed a reversal, the expectations for the length of Wave #5 is that according to Elliott wave theories Wave #5 is expected to equal Wave #1.
CDNX Chart #2
Looking at the chart we see that Wave #1 is equal to a high of 1691 minus the low of 679 which gives a result of 1012. The expected target for Wave #5 is Wave #4 (low) plus 1012 = 1957 + 1012 = 2969. This is quite close to the Fibonacci target of 3042.
The RSI(14) shows that the present level is at the same level when Wave #2 reversed to begin Wave #3.
Conclusion: The above analysis concludes that this is probably the beginning of a reversal from Wave #4 to Wave #5 of the 3rd Motive phase.


9 Comments
I’m always amazed by your analysis of the evolution of the CDNX, which is why I read your blog regularly!
John, if this is a recovery, which I think not, you have already previously mentioned to discount the collapse in 2008 as that was an anomaly; so would that not result in wave 5 not being equal to wave 1? Thanks 🙂
Hi Andrew,the collapse in 2008 was a corrective Phase not Wave #5. Wave #5 on its own is expected to be equal to the lenghth of Wave #1 but Wave#5 often has extensions. It is not always easy to define the waves exactly as any Elliott theorist will tell you, but in this case Wave #1 was approx. 600 and wave #5 was approx. 700 plus an extension after the down month at the beginning of 2007(see red candle). Hope this helps.
THANKS! UNBELIEVABLE INFORMATION AND NICE GRAPHS TO SUPPORT IT!
John, your TA is a top notch. I wish that the reversal does come. However, there is just too much headwinds right now… QE2 hangover, European debt issues, China slowdown etc. So unless Bernanki announces QE3 immediately, I don’t see the Wave #4 materializing.
Thank you, John.
I have to keep stopping by to say thanks for this free analysis, it is really very helpful.
John,adding my thanks to some excellent work
I add my kudos, please keep up the separate “play by play” action on the CDNX as there are not that many sites out there dissecting this junior index as you guys at BMR are doing…good job.