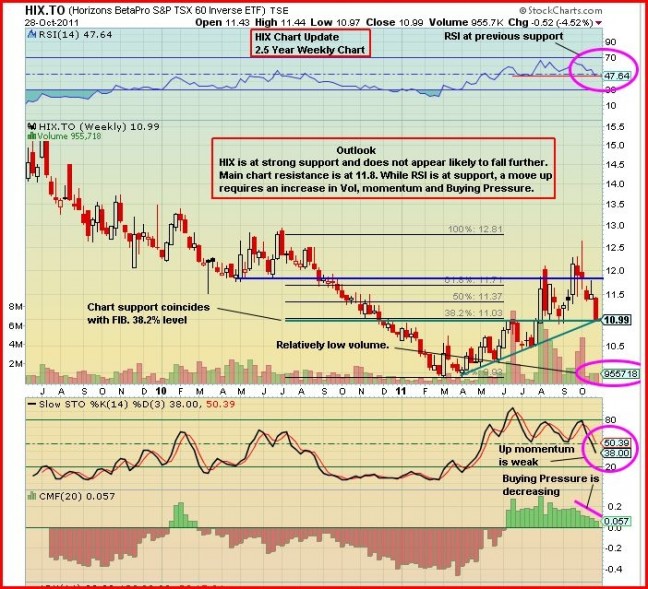
A major problem for bulls right now is not only the resistance the CDNX is up against, but the overall technical condition of the HIX (single leverage) and HXD (double leverage) short ETF’s (TSX). The 15.4% advance by the TSX off its October 4 low of 10,848 has resulted in nothing more than very normal retracements for the HIX and HXD in the context of an ongoing bull phase for these inverse ETF’s which are now trading at important support as John’s chart shows. Experienced traders can play the market volatility to make some profits while another strategy of course is to use one or both of these ETF’s as part of a hedging strategy to reduce portfolio risk. As always, buying into weakness and selling into strength is the winning formula while keeping a close eye on major support/resistance areas.
Below is John’s updated 2.5-year weekly chart for the HIX (the chart for the double-leveraged HXD is almost identical though of course the values are different). The HIX closed Friday at $10.99 while the HXD finished at $9.41. Both are trading just above their rising 200-day moving averages (SMA).

