11:35 am Pacific
John has updated charts this morning on Copper, the U.S. Dollar Index and the Canadian Dollar to give us some additional technical perspectives on the “big picture” at the moment.
Copper, which is currently at $3.86 after falling as low as $3.825 earlier today, is underpinned by very strong support at $3.60. It also faces considerable resistance at $4, a level it will likely test in the near future though a real breakout probably isn’t in the cards just yet. So Copper looks like it will strengthen some more before consolidating again for a period of time. The second half of the year could be very robust for Copper – based on both fundamentals and technicals.
Copper
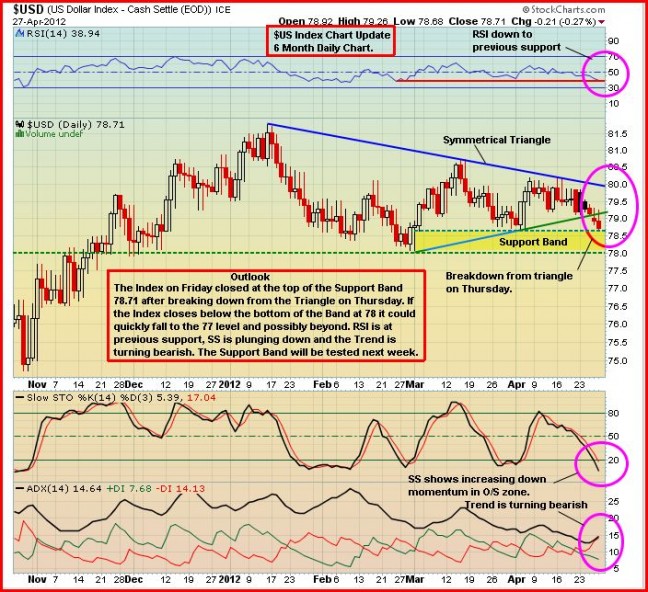
The U.S. Dollar Index, trading just under 79 this morning, has been weak lately but does have excellent support at the 78 level. It has been in a tight trading range between 78 and 80 since mid-March and that could continue for a while yet.
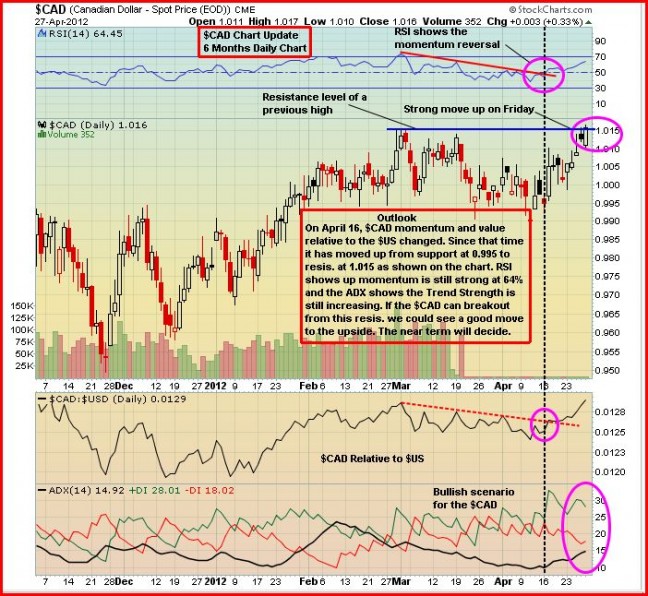
The Canadian Dollar has been interesting. There’s no way this commodity-sensitive currency would be as strong as it is if the global economy were about to fall off the cliff. The rising 100-day moving average (SMA), not shown in John’s chart below, is just a hair under the $1 level.


