Adventure Gold (AGE, TSX-V) has much more going for it than just its recent strategic land acquisitions on Gold Bullion’s doorstep at Granada, but AGE will definitely benefit from the excitement we expect the LONG Bars Zone to generate in the days, weeks and months ahead. Recent GBB drill results demonstrate the LONG Bars Zone is widening and AGE has found significant Gold mineralization (associated with porphyritic intrusions and/or quartz veins with disseminated sulphides in strongly altered and locally well-deformed sediments) while prospecting west and southwest of the LONG Bars Zone. Adventure Gold believes these areas are “extensions” to the LONG Bars Zone which seems very plausible to us. AGE has picked up 200 hectares in total so far at Granada, not a large area but they’re tied on immediately to the west of the LONG Bars Zone and they have also carved out a small slice of the “Eastern Extension” which would definitely form part of any open-pit mining operation at Granada. Some of Gold Bullion’s Phase 2 Eastern Extension holes were drilled extremely close to what is now Adventure Gold’s Property. We expect AGE will be doing some of its own drilling to test its Granada extension properties early in the New Year.
We first brought Adventure Gold to our readers’ attention in late September when the stock was trading in the low 20’s. Today it closed at 45 cents, and the chart looks absolutely phenomenal as John describes in his analysis below. AGE is far from being technically overbought and as John declares, “Seldom does one see a chart looking so positively bullish with chart patterns and indicators in absolute agreement.”
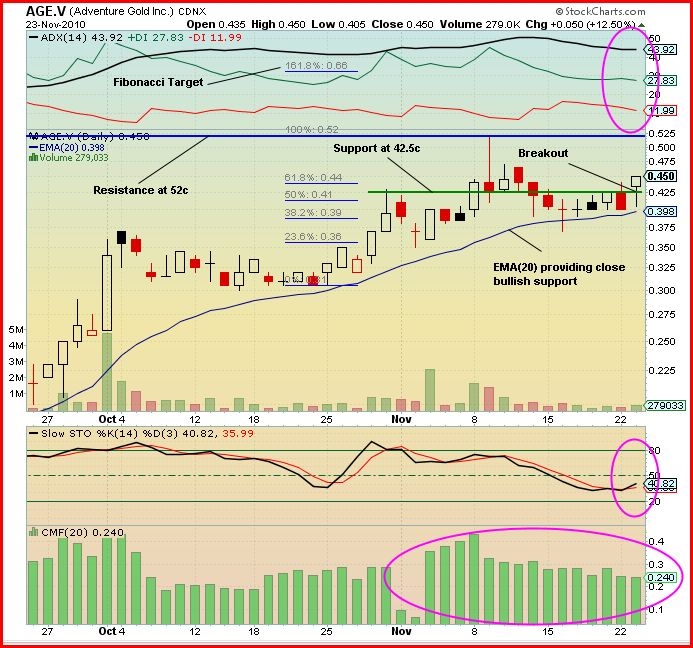
John: Today, Adventure Gold (AGE, TSX-V) gapped up at the open to 43.5 cents from Monday’s close of 40 cents. It then drifted down to a low of 40.5 cents and rebounded during the day to close at its high of 45 cents for a gain of a nickle (12.5%) on CDNX volume of 279,000 shares.
Looking at the 2-month daily chart we see that today it broke out to the upside from the resistance level at 42.5 cents. This resistance is shown as a green horizontal line because now it is support. There is resistance at 52 cents, the previous all-time high, shown as a blue horizontal line. The EMA(20) provides close bullish support at 40 cents.
The set of Fibonacci levels (blue horizontal lines) shows the next Fibonacci target level is at 66 cents (this is not a BMR price target as we don’t give price targets but a theoretical near-term Fibonacci level as a guide for investors based on technical analysis). The previous Fibonacci level, not shown on the chart, was at 53 cents.
The volume today, although relatively low, was the highest in the last 5 sessions. A 5-cent move to the upside with only 279,000 shares traded is a very bullish sign.
Looking at the indicators: The ADX trend indicator has the +DI (green line) flat at 28 and above the -DI (red line) which is flat at 12. The ADX trend strength indicator is flat at a high strength value of 44. This orientation is very bullish.
The Slow Stochastics has the %K (black line) at 41 and crossed above the %D (red line) at 36. A crossover at this low value is very bullish as it allows the stock to move a considerable distance before becoming overbought – very bullish.
The Chaikin Money Flow (CMF) indicator has been completely green (bullish) – above zero – for the past 2 months. The buying pressure has been quite high over the last 11 sessions during the consolidation period. This indicates accumulation – very bullish.
Outlook: Everything about this chart points to a potential major move to the upside in the near future. Seldom does one see a chart looking so positively bullish with chart patterns and indicators in absolute agreement.


2 Comments
Hi John,
Excellent chart analysis as usual. Haven’t bought AGE yet but will have to seriously consider it now. Any news from SFF who have gone very quiet and their chart isn’t exactly a thing of beauty either?
Hi Patrick
Thank you for your comments. SFF is a nightmare for everyone,we’re still waiting for drill results from Miraflores and an overall update on immediate exploration activities and plans for Quinchia. We have heard nothing recently.