John: Tonight we’re taking a look at the chart for Copper, specifically because it has a close relationship with the CDNX and of course the CRB Commodity Index. Copper is also a good indicator of the state of the global economy.
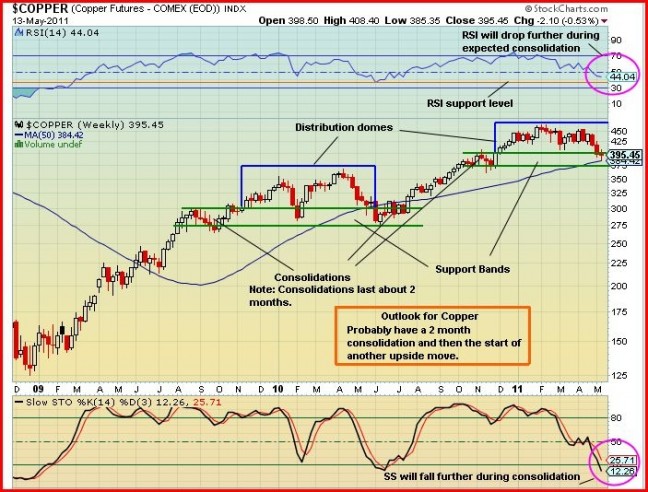
On Friday, May 13, Copper opened at 397.15, climbed to a high of 397.70, fell to a low of 395.30 and then closed at 395.45, down 1.60 (-0.40%) on the day and 2.10 (-0.53%) on the week.
Looking at the 30-month weekly chart, we see that from the bottom after the crash in 2008 Copper consolidated during January and February, 2009, before starting a flagpole. From the beginning of March, 2009, to August that year, it doubled in price from 150 to 300 ($1.50 to $3.00 a pound) in a matter of 6 months. Then it consolidated in a horizontal trend channel until the beginning of November, 2009, when it broke out to the upside and started to form a distribution dome which lasted until the end of May, 2010. Copper then consolidated until a breakout to the upside in mid-July (corresponding with the start of a major CDNX run). It then climbed from 285 to a high of 400 in November, 2010.
Copper consolidated again for about 2 months before breaking out to the upside in January of this year. Since then it has formed another distribution dome. At the moment it appears to be starting a horizontal consolidation which is expected to last about 2 months. This is a realistic assumption, not only because of the previous chart pattern but the positions of the Slow Stochastics (SS) and RSI indicators are such that they can fall further from their present positions during the expected consolidation period before becoming extremely oversold or reaching a previous support level.
Outlook: I expect Copper to continue to consolidate in a range between 375 and 400 over the next 2 months.


1 Comment
Hello Guys,
Any up date on GQC result?