Gold Bullion Development’s (GBB, TSX-V) Granada Gold Property in northwestern Quebec, 65 kilometres west of Osisko’s massive Canadian Malartic Deposit, has been a very significant exploration story since March of this year when Gold Bullion made a discovery of near-surface mineralization in Phase 1 Hole #17, several hundred metres east-northeast of the old Granada mine workings. Since then, over 25,000 additional metres have been drilled at Granada in both the LONG Bars Zone Eastern Extension, where #17 is located, and Gold Bullion’s LONG Bars Zone Preliminary Block Model (immediately to the west of the Eastern Extension) where the company has outlined a potential non-compliant 2.4 to 2.6 million ounces. A 50,000 metre Phase 3 drill program is now underway. As regular BMR readers know, we’ve reported on this story intensely and we fervently believe Frank Basa’s team has a “golden” opportunity to discover another multi-million ounce open-pit deposit along Quebec’s famous Cadillac Trend.
Today, Gold Bullion reported outstanding metallurgical results from test samples taken from the Eastern Extension (recovery rates in excess of 93%), additional evidence that Granada may indeed have what it takes to develop into a large and robust open-pit operation. A great deal of work needs to be done yet but with these kind of metallurgical results and some more holes like #55 reported just last week (116 metres grading 1.69 g/t Au over a wider interval of 356.6 metres of 0.60 g/t Au), Gold Bullion is definitely on the right track and appears to be gaining momentum. The stock price stalled from mid-September to just recently, due to a financing and a lack of results because of assay lab back-ups, but the company says it now expects a regular flow of assays and interest in the play is once again heating up significantly.
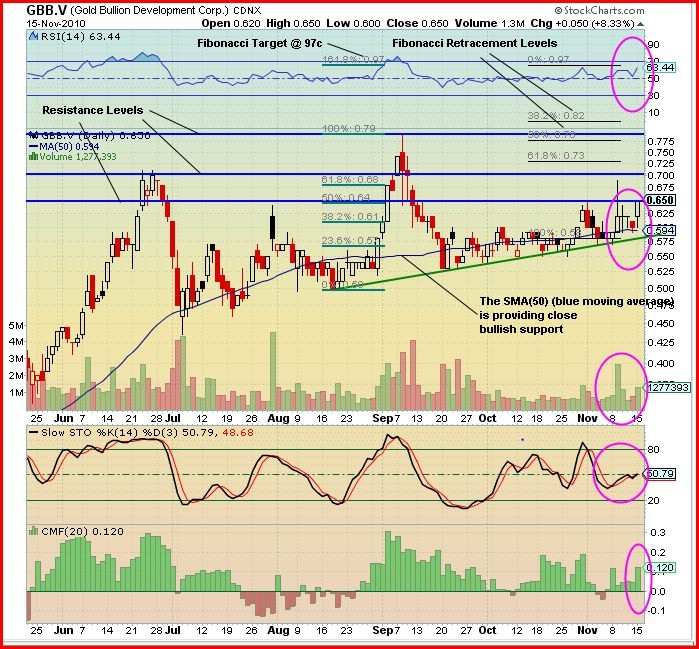
Tonight, John examines a GBB chart that is looking more exciting now than it has for over 2 months:

John: Today, GBB opened at 62 cents, drifted down to its low of 60 cents, then climbed steadily and methodically to close at its high of 65 cents for a gain of a nickel (8.33%) on total CDNX volume of 1.3 million shares (278,000 on ALPHA).
Looking at the 6-month daily chart, we see that starting around mid-August the trading pattern formed is a bullish ascending triangle with the top horizontal blue line at 65 cents being the resistance and the upsloping green line providing long-term support. Today’s trading finished right at the 65 cent resistance line, so we are looking for Tuesday’s trading to attempt to break above this level. Two other resistance levels are shown – 1 at 70 cents, which is the pivotal level from a previous high in June, and the other at 79 cents which is the all-time high from early September.
This very bullish move today really began on Monday, November 8, where we see a small white candle. Since then all 5 trading sessions have closed above the daily SMA(50) moving average which provides close bullish support. Last Friday’s trading (red candle) can be ignored because all markets were hit hard by the bears. The last 6 trading sessions have provided a strong base for a bullish move up. This is supported by increased daily volumes.
There are 2 sets of Fibonacci levels shown. The set to the left (in green) shows the next target is 97 cents (this is not a BMR price target, as we don’t give those, but a theoretical Fibonacci target). The set on the right indicates that if the Fibonacci 97 cent target is reached, the expected Fibonacci retracements are 82 cents for a 38.2% retracement and 78 cents for a 50% retracement.
Note that the present resistance level shown is at 79 cents which is very close to the 50% retracement level, thus if the retracement gets to that level it will encounter very strong support. Remember, broken resistance becomes support.
The period from mid-September to now has been a time for consolidation and accumulation.
Looking at the indicators:
The RSI has bounced up off the 50% level and is now at 63% and pointing up. This has plenty of room to move higher without becoming overbought – very bullish.
The Slow Stochastics has the %K (black line) at 51% and above the %D (red line) at 49%. It’s pointing up and also has plenty of room to move higher without becoming overbought – very bullish.
The Chaikin Money Flow (CMF) indicator shows the last 7 trading sessions had bullish buying pressure with today’s level the highest at 0.12 – very bullish.
Outlook: Today, GBB made a convincing move up without being excessive. There is a strong base with the indicators and trading patterns suggesting real potential for a serious near-term acceleration to the upside.
