Gold has traded between $1,287 and $1,305 so far today…as of 7:30 am Pacific, bullion is up $10 an ounce at $1,300…Silver is 44 cents higher at $19.59 (see updated Silver charts at the bottom of today’s Morning Musings)…Copper has jumped 6 cents to $3.14…Crude Oil is 71 cents higher at $100.70 while the U.S. Dollar Index is off slightly at 79.82…

Gold has knocked on the door of its rising 100-day moving average (SMA) in the mid-$1,280’s in six out of the last 11 sessions, including today, and has managed to hold that support so far…as John’s updated 1-year Gold daily chart showed in our Week In Review And A Look Ahead posted Saturday, strong Fib. support runs from the low $1,250’s (38.2%) to $1,291 (61.8%)…
The tense situation in Ukraine continues to give Gold a risk premium and should help limit any selling…fresh physical demand would be helpful…on that note, the winds of political change are brewing in India and the final outcome of protracted and historic national elections in that country will be known at the end of this week…63-year-old Narendra Modi, who has been advocating sensible pro-growth policies and has won the favor of the Gold lobby in India, is expected to lead the BJP (Bharatiya Janata Party) to victory…this should lead to an easing of the Gold import restrictions in India, and usher in new economic policies to boost a faltering economy…such developments would certainly be helpful for the Gold market, short-term and longer-term…
Today’s Equity Markets
Asia
China’s Shanghai Composite posted an impressive 42-point gain overnight to close at its highest level in two weeks, 2053…investors cheered a blueprint of capital market reforms unveiled Friday by the State Council that should boost market liquidity in China…the reforms include proposals to further open up the country’s stock and bond markets, relax foreign ownership of companies and pursue both inward and outward investment…
China will not use any large-scale stimulus to boost its economy, Central Bank Chief Zhou Xiaochuan was reported as saying on Saturday, in response to speculation that authorities might lower reserve requirements for banks to spur growth…Xiaochaun, who was speaking at a closed-door session at the Tsinghua University, was also reported by Phoenix New Media Ltd as saying the central bank would only “fine-tune” its policy to counter economic cycles…
Japan’s Nikkei closed 42 points lower at 14150…
Europe
European markets are up strongly in late trading overseas with resource companies leading the way…
North America
The Dow hit a new record high this morning and is up 93 points at 16676 as of 7:30 am Pacific…the TSX has jumped 80 points while the Venture is off a point at 990…
CDNX: “Sell In May And Go Away?” Not This Time – Rather, “Buy In May And Avoid Dismay”
Updated CDNX Charts – Why The Venture Is In A Bullish New Phase
We have some important new charts this morning that help explain why the Venture’s technical posture has radically changed in recent months, and how this market has entered a bullish new phase that could accelerate rapidly during the second half of the year…refer to Saturday’s Week In Review And A Look Ahead for an examination of a 5-year weekly chart that shows the incredible support underpinning the CDNX between the 940’s and the 980’s…a reversal to the upside in the Venture’s 300-day moving average (SMA) is also looming on the horizon, a critical technical event that could quite possibly occur by the end of June…the 200-day has already reversed and forms part of that rock-solid support between the 940’s and the 980’s…
There’s ample evidence to suggest that a very robust – indeed, a STELLAR – third quarter is in the works for the Venture, powered by strong technicals and the good possibility of fresh discoveries…selectivity will be key – if you’re in the right plays, fortunes could be made in our view over the next 3-6 months given the current set-up and how things could unfold…
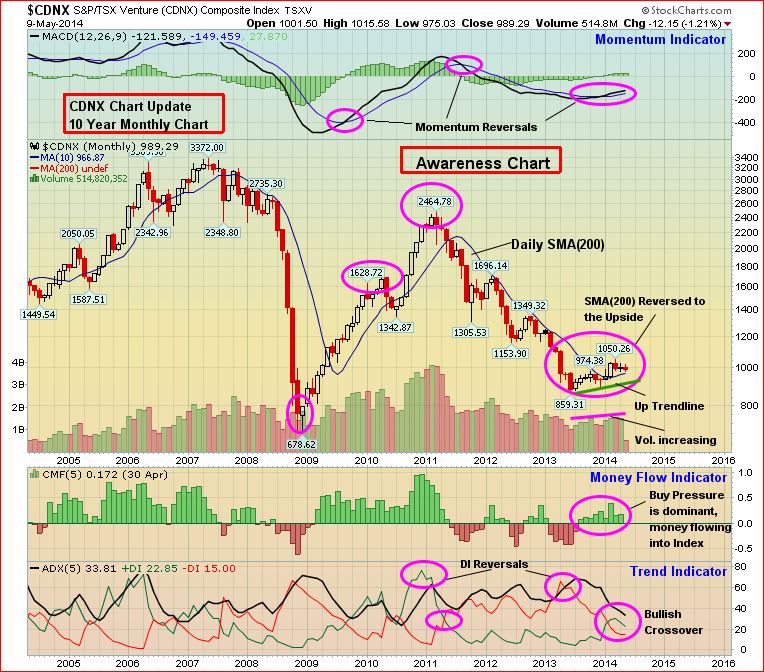
Below is a 10-year monthly chart that shows the “Big Picture” of what is likely emerging…
MACD Momentum Indicator
First, take a look at the MACD (Moving Average Convergence Divergence, a momentum indicator that measures the difference between short-term and long-term moving averages)…the MACD has proven to be a highly reliable trend indicator for the Venture…
Three important reversals are circled in blue at the top of this chart going back to 2009…the first reversal marked a wise entry point for investors – many who “loaded up” at this time made a lot of money…the second reversal in early-mid 2011 was a sell signal and a clear indication of pending trouble…the third reversal began forming late last year and has been confirmed through these first several months of 2014…combined with many other indicators, including Fib. numbers and a now-rising 200-day SMA, the evidence is overwhelming that the Venture bear market is over and a bullish new cycle has started…momentum should pick up significantly in Q3…
ADX Trend Indicator
What’s also critical is that there has been a bullish +DI/-DI crossover in the ADX trend indicator as shown at the bottom of this chart…-DI crossed above +DI, marking a bearish primary trend reversal during the second quarter of 2011…it took nearly three years, during which there was a 65% drop in this market, but a bullish reversal (+DI moving above -DI) finally occurred at the beginning of this year…that’s not a trend you want to bet against…
CMF Indicator – Money Flow
We’ve now seen the longest period of Venture buy pressure on the 10-year monthly chart since 2009…money is flowing into the Index – this is critical…always follow the money…
Volume
Volume is one of the most important indicators of all (some would argue the most important)…Venture volume has picked up considerably since its lows of 2013…this volume increase has occurred at the same time as the trend reversal – very important…
New Uptrend Line
This 10-year monthly chart shows a lot, so it might be easy for some to miss something quite significant – note how a new uptrend line has formed from the low of last June (this is indicated by the green line in the big circle on the right side of the chart)…
Venture 3-Year Weekly Chart
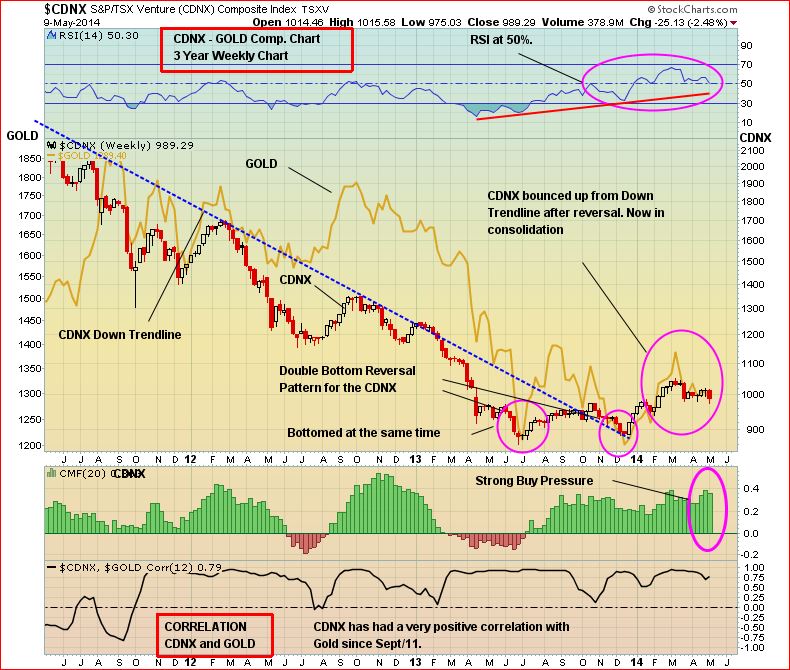
The Venture 3-year weekly chart was extremely helpful during the last quarter of last year in terms of identifying a major market reversal point…what occurred in October was a breakout above a long-term downtrend line…following that breakout, the downtrend line then became support, and the Venture repeatedly tested that support successfully until the end of December when it decided to take the path of least resistance which was up…
Notice the huge change in the RSI(14) pattern – it has been climbing an uptrend line since extreme oversold conditions emerged during the second quarter of last year when the Index bottomed at 859…buy pressure is strong and the Venture has recently been performing much better relative to Gold than it has at any point since 2011…
Venture 6-Month Daily Chart
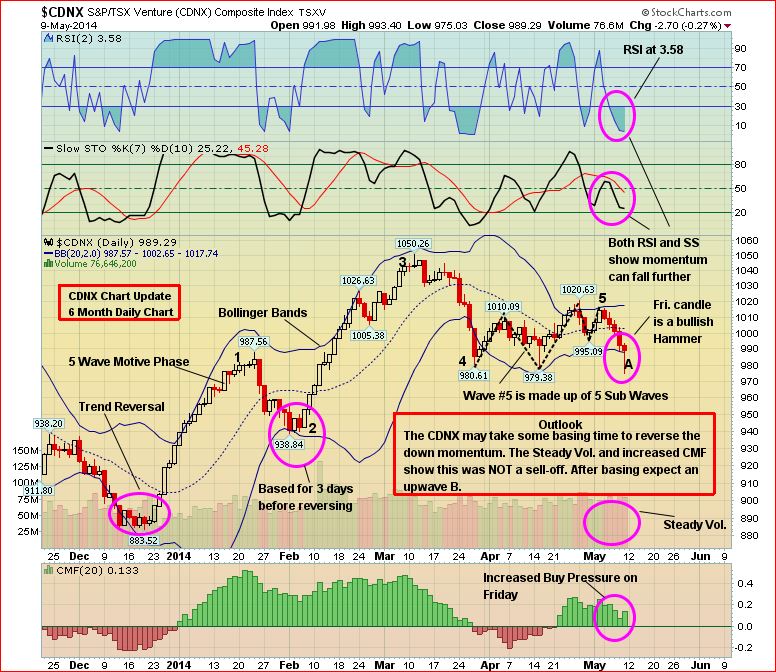
This short-term chart shows RSI(2) has plunged to an extreme low of 3.58, consistent with the March and the late January/early February RSI(2) lows when the Venture found very strong support and reversed higher…while it’s possible that RSI(2) and SS could fall a little more, additional downside from current levels is indeed limited which adds further credence to the argument that the incredible support band ranging from the 940’s through the 980’s will hold…
Last week’s decline in the Venture was normal retracement activity, and more choppiness and testing of support could certainly occur near-term…but this is healthy and a classic accumulation opportunity as well…what we saw Friday – a 16-point intra-day reversal – was a bullish hammer and we’ll see if that carries any significance over the coming days…don’t get frustrated and impatient by the fact the Venture met resistance at 1050 in March…this healthy pullback has been less than 10%, and has also cleansed temporarily overbought conditions…
Doubleview Capital Corp. (DBV, TSX-V) Update
Last week was a powerful one for Doubleview Capital (DBV, TSX-V) as it soared from 26 cents to a new all-time high of 40 cents before settling Friday at 35 cents for a 31% weekly gain…speculation is obviously ramping up with regard to upcoming results after the company recently completed its first phase of 2014 drilling at the Hat to follow up on discovery holes HAT-08 and HAT-11…DBV’s April 30 news release stated that results from this latest drilling can be “expected within four weeks”…
What’s driving Doubleview is not just the potential of the Hat Property, given results to date, and the prolific nature of the Sheslay Valley, but the vision and steadfast determination of President and CEO Farshad Shirvani…during our Hat Property and Sheslay area visit a month ago, we were able to conduct a 1-hour video interview with Shirvani…we’ll be showing some excerpts of that next week…what that interview revealed is a very focused individual who understands the challenges he faces but has a vision and a game plan, including the right people surrounding him, to succeed…that’s what it takes in life to be a winner…the junior exploration business is no different…
“We’re going to have a very aggressive year, that’s my plan,” Shirvani told us. “For that aggressiveness, the plan that I have, we need more than one rig. I don’t know how many right now but we have it on the plan. I’m really working on it, setting the blueprint. My plan…the dream is…to have it (the Hat) at a level where we have a resource calculation by the end of this year – at least on the four anomalies that I’m planning to put into action. I want to do it as I want to give the company what it deserves – and put it in as an asset of the company.”
During our couple of days at the Hat, there wasn’t anything Shirvani wasn’t prepared to do – whether that meant cooking a meal, hauling equipment, prospecting, offering encouragement, or finding a new way to save some money for shareholders…it’s that kind of leadership that gives us confidence that Doubleview has a great shot at remarkable success…the same can be said, in fact, for all the companies active in the district which is one key reason we’re so bullish on the entire Sheslay Valley – interestingly and importantly, each company in the area has its own unique “people strengths” and we’ll explore that issue in more detail in the coming weeks…

DBV 3-Year Weekly Chart
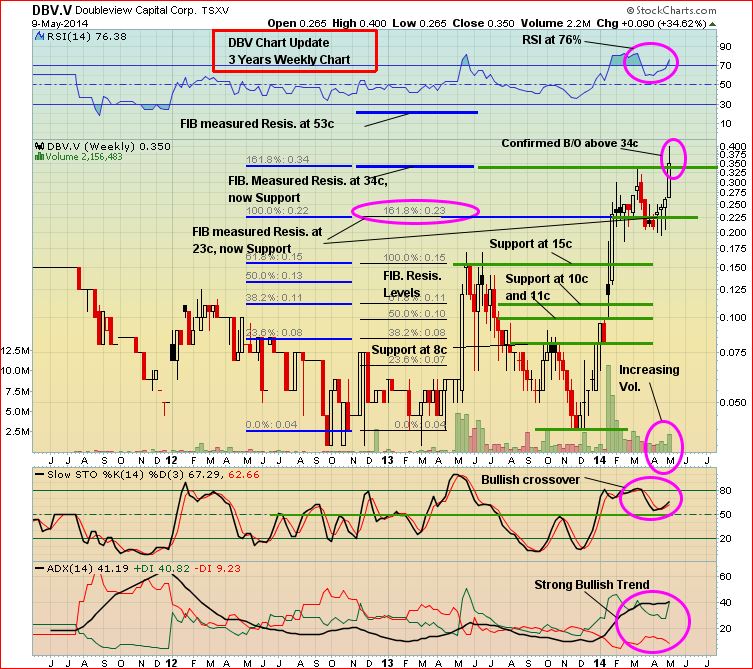
Below is an updated 3-year weekly DBV chart from John…with a confirmed breakout above 34 cents, what to watch for now is whether that level now holds as new support…the overall trend remains strongly bullish, as shown by the ADX indicator…the rising 50-day SMA (not displayed on this chart, currently at 26 cents) provides strong secondary support…ultimately, drill results will of course determine the stock’s fate, and there is risk in DBV as there is in almost any investment…never invest money you can’t afford to lose and never forget to take profits off the table from time to time…that said, nothing beats the leverage this industry provides, and the Sheslay Valley sure feels like it’s shaping up to become the hottest exploration camp B.C. has seen in many years…DBV is unchanged at 35 cents as of 7:30 am Pacific…
Nevada Sunrise Gold Corp. (NEV, TSX-V) Update
2014 is shaping up to be a very interesting year for Nevada Sunrise Gold (NEV, TSX-V) which holds 20.1% of the Kinsley Mountain Project as a JV partner with Pilot Gold (PLG, TSX)…the Western Flank target at Kinsley Mountain is producing impressive high-grade Gold numbers, and drilling has recently restarted there with one core rig and two RC rigs…
NEV is in the process of closing of a $2 million financing at 90 cents (t currently has just 19 million shares O/S after a 1-for-10 rollback late last year) to help fund its share of Kinsley Mountain and to advance its other Nevada Gold project, Golden Arrow, which is situated along the northeast margin of the prolific Walker Lane structural zone…
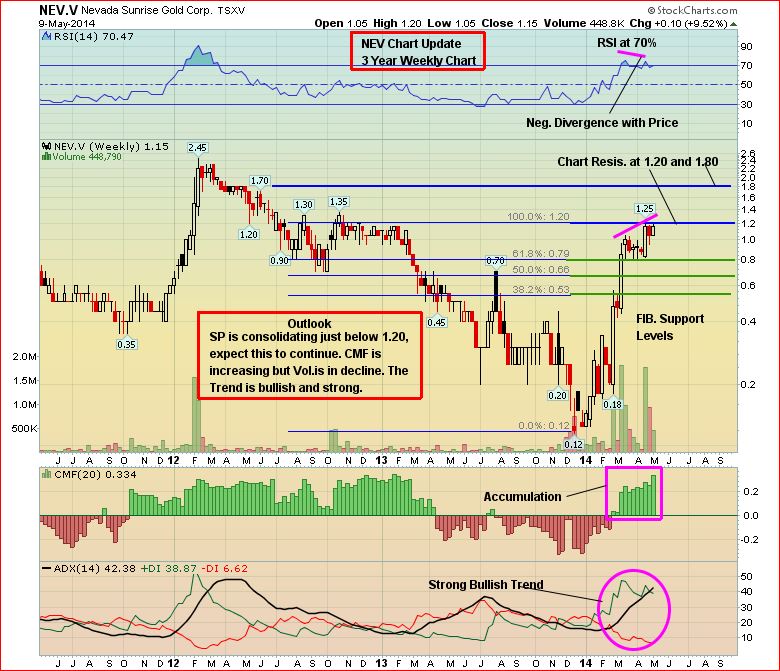
Technically, NEV’s near-term resistance is $1.20 as shown on this 3-year weekly chart while there should be very strong support between the Fib. 61.8% reracement level of 79 cents and the rising 50-day SMA, currently at 90 cents where the financing is being completed at…as always, perform your own due diligence – NEV can expected to be volatile, but Kinsley Mountain is looking very promising in our view and we’ll be continuing to keep a close eye on developments there…NEV is off 8 cents at $1.07 through the first hour of trading…
NEV 3-Year Weekly Chart
Petromanas Energy Inc. (PMI, TSX-V)
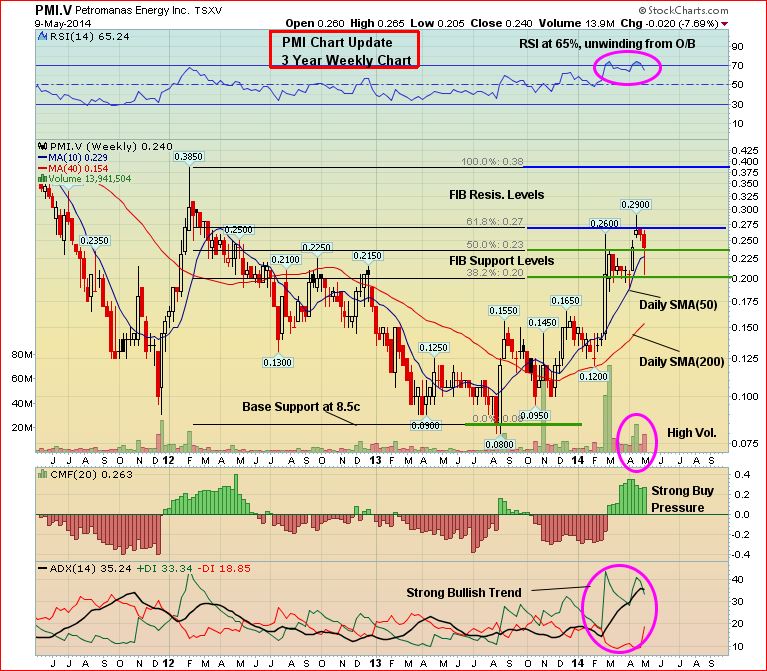
Another energy play our readers should have on their radar screens is Petromanas Energy Inc. (PMI, TSX-V) which is targeting high-impact oil and gas resources in Europe and Australia…PMI has been on the rebound since last summer when it bottomed at 8 cents…it has recently backed off from a 52-week high of 29 cents and is unchanged at 24 cents as of 7:30 am Pacific…the rising 50-day SMA, currently at 23 cents, has provided consistent support since last summer…below is a 3-year weekly chart…strong buy pressure has replaced sell pressure which was dominant since mid-2012…
PMI 3-Year Weekly Chart
Silver Short-Term Chart
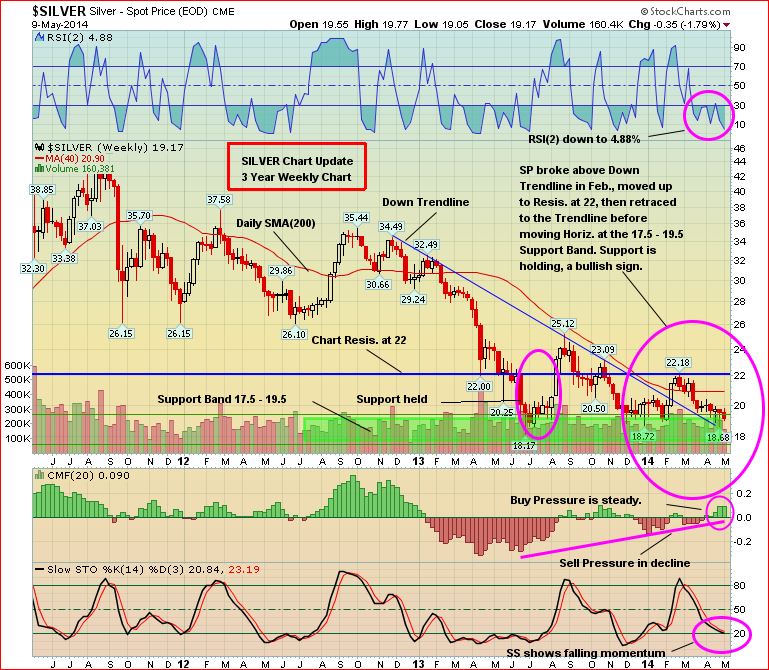
Importantly, Silver continues to find support just below $19 at and near the top of a downtrend line…this is similar to the Venture pattern during the fourth quarter of last year when it, too, found support at the top of a downtrend line…RSI(2) on this 3-year weekly chart is at very low 4.9% while SS appears to be forming a bottoming pattern – combined with steady buy pressure, these are encouraging signs…the support band between $17.50 and $19.50 should therefore hold while the next major chart resistance is $22…
Silver Long-Term Chart
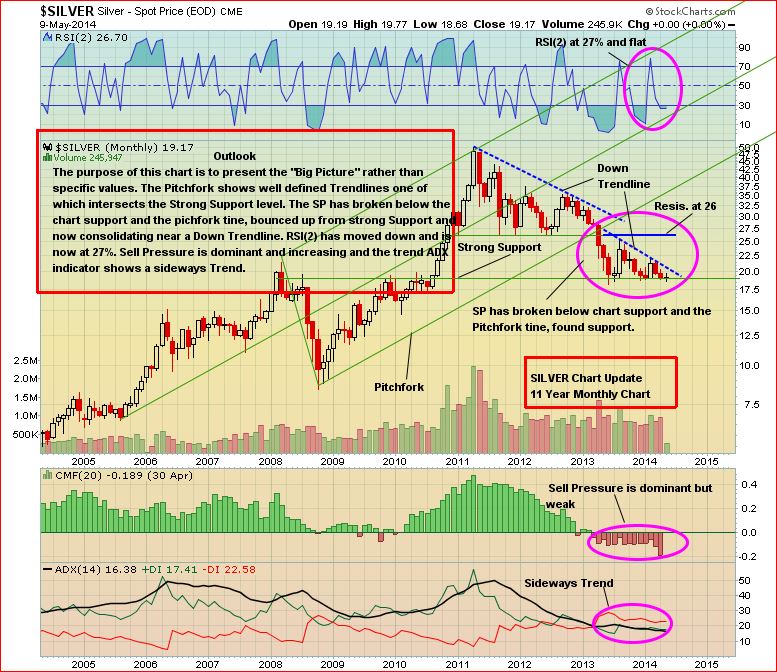
This 11-year monthly chart confirms that the metal has exceptional support just below $20…note that Silver has two downtrend lines it needs to break above…if and when Silver clears stiff resistance at $26, watch out – you’ll want to back up the truck and load up…
Note: Jon holds a share position in DBV.

6 Comments
Any comments on Balmoral today ?
Harold, excellent results, those are certainly bonanza grades, and you have to love high-grade…also demonstrates how BAR has an impressive suits of properties as they’ve also been getting promising results from Grasset as we’ve pointed out…our last chart showed resistance at 90 cents, we’ll see how this closes today and probably run a fresh chart tomorrow with a further review of results…
GMA, announced shareholder rights plan last week on the eve of their separation results. Farshad may want to consider the same if results are epic.
Farshad and some very close investors hold majority shares.
What do you expect as far as result are concern Paul?
Thats the 64 million dollar question but I think these results will be significant and the market will react accordingly. On the last drill program Farshad came back and raised some money because he wanted to show tonnage and then he returned back to drilling, this time around he has stopped drilling and still has cash in the kitty, which to me indicates that Farshad is happy and comfortable with what he has found and that he will be able to finance at much higher prices. Frashad is all about keeping dilution to a minimum and he’s done an excellent job of it.