Gold has traded between $1,255 and $1,268 so far today as it tries to stabilize after yesterday’s $30 plunge…Silver is off 4 cents at $18.99…Copper is flat at $3.18…Crude Oil has retreated 55 cents to $103.57 while the U.S. Dollar Index has climbed nearly one-fifth of a point to 80.53…
 A combination of fundamental and technical factors led to Gold’s tumble yesterday to a 3.5-month low…”symmetrical triangles” can break one way or the other, and this one broke to the downside for bullion which in turn triggered stop-loss orders…fundamentally, a string of upbeat U.S. economic data didn’t help Gold yesterday while U.S. and some European equity markets hit multi-year highs…geopolitical tensions seemed to have eased somewhat, further impacting Gold’s safe-haven appeal…on the bright side, the Venture held up very well yesterday and continues to suggest that Gold is not about to fall out of bed, even though bullion was tossing and turning rather vigorously yesterday and may test support at lower levels…some clear signs of a pick-up in physical demand need to emerge, and that is yet to be seen in China – the world’s largest Gold consumer – given the current low premiums on the Shanghai Gold Exchange…
Gold 6-Month Daily Chart
John’s 6-month daily chart shows how a symmetrical triangle broke to the downside yesterday…RSI(14), at 33%, is very close to the late December low…important Fib. support is around $1,260 while chart support below that is between $1,220 and $1,240…this is certainly a set-up for the emergence of oversold conditions in the near future – no reason to panic…
Today’s Equity Markets
Asia
China’s Shanghai Composite gained 16 points to close at a two-week high overnight…April industrial profits rose 9.6% on year, slightly below March’s 10% gain…Japan’s Nikkei finished 34 points higher…
Europe
European shares are mixed in late trading overseas…euro zone economic sentiment improved more than expected in May, driven by higher confidence among consumers and industry managers, survey results showed today…the economic sentiment index rose to 102.7 in May (beating expectations of 102.2) from 102 in April, the European Commission said…meanwhile, the rate of growth in M3 money supply, which the ECB uses as a gauge of future inflation, slowed to an annual 0.8% in April, the lowest since 2010, from a revised 1% a month earlier…ECB officials are due to meet a week from tomorrow (June 5) to set monetary policy after President Mario Draghi said earlier this month that the Governing Council was “comfortable” taking measures to boost inflation in the euro area…
North America
The Dow is off 27 points as of 8:30 am Pacific…the TSX has slipped 88 points while the Venture is down 5 points at 981…the energy sector continues to show market leadership on the Venture, another reason we’re excited about Edge Resources Inc. (EDE, TSX-V) which is still flying “under the radar” of many investors…EDE has backed off a penny-and-a-half to 19 cents through the first two hours of trading today…EDE has enjoyed quite a turnaround in its fortunes recently and we suggest readers perform some due diligence on it…
Petromanas Energy Inc. (PMI, TSX-V) Update
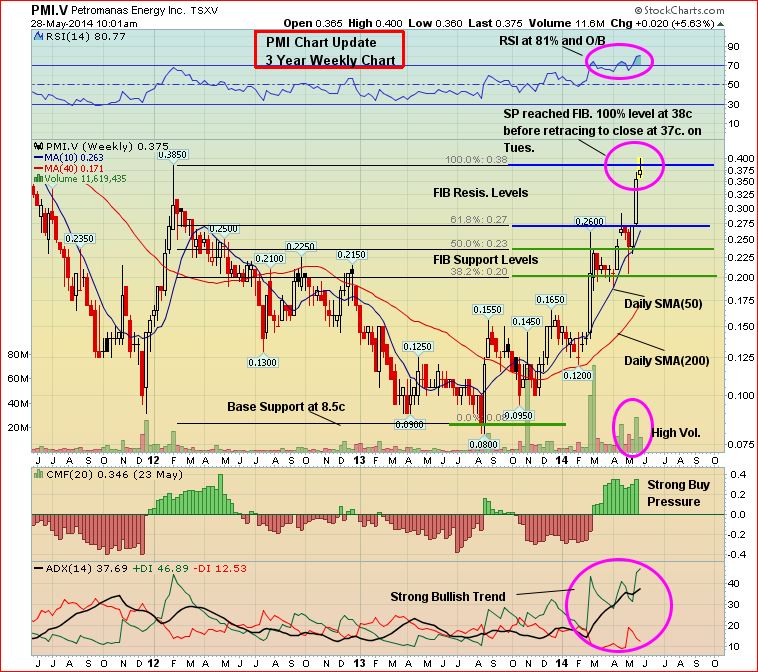
John made a good call on this one in the low 20’s recently, but Petromanas Energy (PMI, TSX-V) reached measured Fib. resistance at 38 cents yesterday with RSI(14) now in overbought territory at 80% on this 3-year weekly chart…some near-term consolidation is very possible, based simply on technical considerations…the 50-day SMA has been a strong supporting moving average…PMI is up a penny at 38 cents as of 8:30 am Pacific…
Source Exploration Corp. (SOP, TSX-V) Update
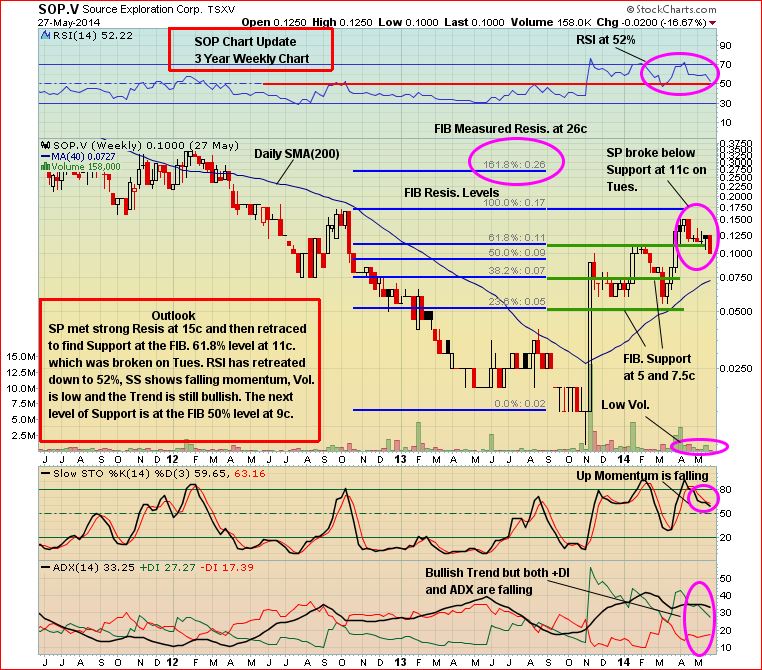
Bargain-hunters may wish to keep a close eye on Source Exploration (SOP, TSX-V), especially in the event of any additional weakness…SOP recently raised $1.2 million after producing some highly encouraging drilling results, including 97.2 m grading 2.72 g/t AuEq from the Santa Cruz target at its Las Minas Project in Mexico…technically, while the primary trend remains bullish, a test of strong support at slightly lower levels can’t be ruled out in the near future, even as the company prepares for follow-up drilling…a strong support band runs from 7 cents, the rising 200-day SMA, and a Fib. retracement level, to 11 cents…the rising 100-day SMA is at 10 cents where Source closed yesterday…SOP may consolidate within this support band prior to resuming its uptrend…it’s up half a penny at 10.5 cents as of 8:30 am Pacific…

Calibre Mining Corp. (CXB, TSX-V)
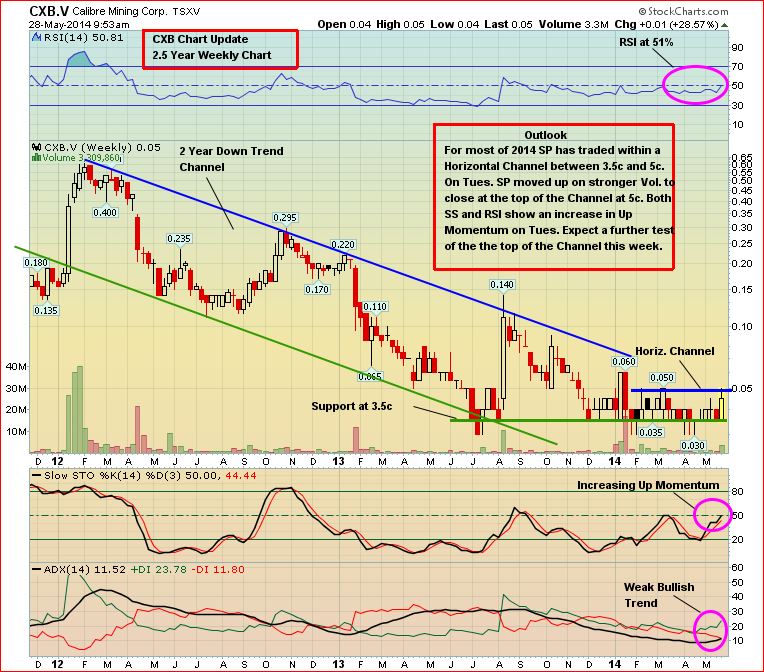
Calibre Mining (CXB, TSX-V) traded over 3 million shares yesterday and climbed from 3.5 cents to a nickel after announcing that it has optioned its Eastern Borosi Project in Nicaragua to IAMGOLD Corp. (IMG, TSX)…CXB has 100%-owned projects in Nicaragua as well as partnerships with mid-tier producers IAMGOLD and B2Gold Corp. (BTO, TSX), so millions will be spent on CXB’s properties in this favorable jurisdiction over the next few years…
Yesterday’s trading took CXB to the top of a horizontal channel it has traded within for most of this year…the 200-day SMA is also at a nickel, and that moving average has provided stiff resistance since CXB broke below it in early 2013 with that SMA also reversing to the downside…it appears CXB is in the beginning stages of a turnaround that could become much more pronounced during the second half of this year, so readers should keep this one on their radar screens…patience is the key, as always…very strong support at 3.5 cents…CXB is off half a penny at 4.5 cents as of 8:30 am Pacific…
Note: John, Jon and Terry do not hold share positions in PMI, SOP or CXB. John and Jon both hold share positions in EDE.


11 Comments
I think that perhaps gold can fall to about 1000-1200! It must be manipulation! What I dont understand is when the chinese buy why does gold not spike upwards? Or do they not buy right now?Is there someone out there who have any thoughts about this? I am so frustrated about gold right now!!
aln halted news pending
FNC.v now at 11.8 million shares traded on all exchanges.
stockwatch.com/Quote/Detail.aspx?symbol=FNC®ion=C
Hey guys,
This is really depressing time for gold. Is this manipulation or what? How long can this continue? All my stocks are in the gold sector and the value has shrunk with 80%. BMR, are you guys still positive about gold? Will we see a gold bullmarket soon?
Appreciate any answears to my concerns.
Brgds
Depressed Swedish guy
Let’s see, everyone was all pumped up and going crazy about Gold at $1,900 an ounce, and we know what happened after that. You and others are now saying this is a “really depressing time” for Gold. Holdings in the SPDR Gold Trust are now at their lowest levels since late 2008 (great sign). This is a fantastic time to be excited and positive about Gold. Don’t let day-to-day swings and short-term volatility throw you off.
Hi Jon, I have been studying drill holes position for PGX, A, B, C, and d are well position for resources expansion (even conservative in a way of risk taking. Wonder what could appen to the share price if E and D. East and North Star could provide similar mineralisation and thickness than star? than they need to connect those zone.
Hi Martin, PGX has put an incredible amount of time, data and expertise into selecting drill targets to kick off their 10,000 m campaign. There’s certainly a disconnect between current market action and where this project is headed, but they will let the drill bit do the talking – and my hunch is, it will speak very loudly in due course. As good as the Star is, based on the 29 holes drilled to date over a footprint of 300 m x 300 m, it’s likely just the tip of the iceberg given the the extensive geophysical, geochemical and geological evidence elsewhere on the property (keep in mind, this is the most advanced property in the entire district). They should be able to demonstrate that this system is much larger than what has been identified to date, and probably richer in some parts as well. You’ll notice that some of the holes you see on the PGX drill plan are being drilled away or are off-set from the chargeability highs – results from those holes are going to be very interesting, will aid greatly in the understanding of the overall district. The real “juicy” stuff, I suspect, is peripheral to the chargeability highs. That creates quite a dynamic and some major exploration upside in all directions from the Star porphyry.
I their last fall news release they state that less than 20% of the Star copper gold porphyry body has been drill tested. Now they are looking to test it all. North Star seems to be their biggest bet if there is a chance of connecting zone, wich may help AIX a bit about 1 1/2 km to the north
PGX being the most advance in the district was the main point in buying with them. Have you spoke with ABR or AIX recently. Do you plan another visit on site this summer?
Martin, Pyrrhotite Creek 4.5 km SW of the Star is the other area to watch closely, much more so than Copper Creek. That’s where the second drill will go in mid-June. Yes, we’re looking at a return visit in July. With regard to ABR and AIX, they are forging ahead vigorously and like with the rest of the Sheslay players, it’s not difficult to discern that some heavy duty action is in the works.
In 1971 143 FT of 0.485% CU starting at 28ft at copper creek, this is significant and is’t about 3 km from the star.