Gold has traded between $1,193 and $1,199 so far today…as of 7:30 am Pacific, bullion is up $2 an ounce at $1,195…the rising 20-day moving average (SMA) at $1,189 is providing support…Silver has added 2 cents to $16.30…Copper is flat at $2.95…Crude Oil has fallen $1.40 a barrel to $64.44 while the U.S. Dollar Index is off nearly one-tenth of a point at 89.29…
 Some interesting notes concerning China and Gold from Frank Holmes, CEO and Chief Investment Officer for U.S. Global Funds, in his weekly Investor Alert at www.usfunds.com. “China’s central bank seems to view the current price levels in Gold as opportunistic. The Peoples Bank of China circulated a draft plan to further ease import restrictions on bringing Gold into China. Qualified miners, all banks that are members of the Shanghai Gold Exchange, and even commemorative Gold and Silver coin makers would be eligible to import bullion. The move would hopefully cut the premium paid to direct Gold imports to China and may encourage miners and refiners to seek opportunities outside of China to secure Gold.
“Tightening the supply demand balance for new mine production, China, the world’s largest producer, is forecast by the China Gold Association to see its current 10% Gold production growth rate to fall by 2015 as lower prices deter new capital deployments to grow production.”
Today’s Equity Markets
Asia
Another robust performance overnight by the Shanghai Composite which surged 84 points or 2.9% to close above 3000 for the first time since April 2011…this is after a 9% jump last week, the Shanghai’s best weekly performance in 5 years…Chinese trade data today revealed a sharp slowdown in November exports and imports which may drive stimulus expectations…the country’s trade surplus, however, rose to $54.5 billion, beating estimates…
Japan’s Nikkei edged slightly higher to close just 64 points shy of 18000…the Japanese economy contracted 1.9% in annual terms in the July-September period, according to revised data released today that confirmed a recession in the world’s third-largest economy ahead of parliamentary elections this coming Sunday…data for both business and public spending were worse than anticipated…
Europe
European markets are down modestly in late trading overseas…
North America
The Dow is relatively unchanged at 17957 as of 7:30 am Pacific…
The TSX, with the energy and financial sectors under pressure, has fallen another 250 points to 14224 while the Venture is 9 points lower at 693 as of 7:30 am Pacific…
Will The Drop In Oil Lead To A Jump In Gold Sales In India?
There is clearly a direct connection between the drop in Oil prices and the decision by authorities in India about 10 days ago to begin relaxing that country’s restrictions on Gold imports…if weakness in Oil continues well into 2015, as expected, it’s conceivable that all restrictions on Gold imports in India could be scrapped – India, in fact, could increase Gold imports to record levels and still not add to the current account deficit if Oil prices remain around current levels…savvy traders who picked up on this may have contributed to Gold’s major reversal a week ago today, shortly after India announced the elimination of its 80:20 rule on Gold imports…
The Reserve Bank of India is “reasonably comfortable” with the current account deficit because of lower Oil prices, Deputy Governor H R Khan stated last Wednesday. “So taking all that into account, a view has been taken that we’ll give up this 80:20,” he told reporters.
India’s restrictive Gold and Silver import duties were imposed by the previous government to help control the country’s current account deficit, with annual Gold imports in particular contributing so strongly to the deficit…the government raised the import tax on Gold, and the central bank also placed aggressive curbs on imports of the yellow metal as it was one of the biggest drivers of India’s trade deficit the measures helped narrow the trade as well as the current-account gap, though this intervention also led to a substantial increase in Gold smuggling…
India’s current-account deficit had touched an all-time high of 6.7% of GDP in the last quarter of 2012 and remained uncomfortably wide in the first half of 2013, dragging the rupee to a record-low…both the RBI and the government have said that a current account deficit of up to 2.5% is acceptable, and it slid to 1.7% in the second quarter of this year (the Q3 current account deficit should show further improvement with the drop in Oil prices)…
Crude is India’s largest import item by value, followed by Gold…together they accounted for 42% of all imports in October…however, Oil imports by value are falling sharply, with October’s $12.36 billion being 19.2% below the same month last year…this represents a reduction in the current account deficit of about $2.6 billion, and that’s just 1 month of Oil imports…
Conservatively, India should save in the neighborhood of at least $40 billion on Oil imports in 2015 versus 2013 if current price levels persist…this is based on an average Brent oil price of around $108 a barrel in 2013 and daily imports of around 4 million barrels, 5% above what they have been in the first 10 months of this year…
In contrast, even if Gold imports recover to 2013 levels of just under 1,000 tonnes from the current likely 2014 outcome of around 850 tonnes, the extra cost is less than the saving on Oil…if Gold averages around $1,200 an ounce in 2015, 1,000 tonnes would cost about $38.4 billion…
WTIC Long-Term Chart
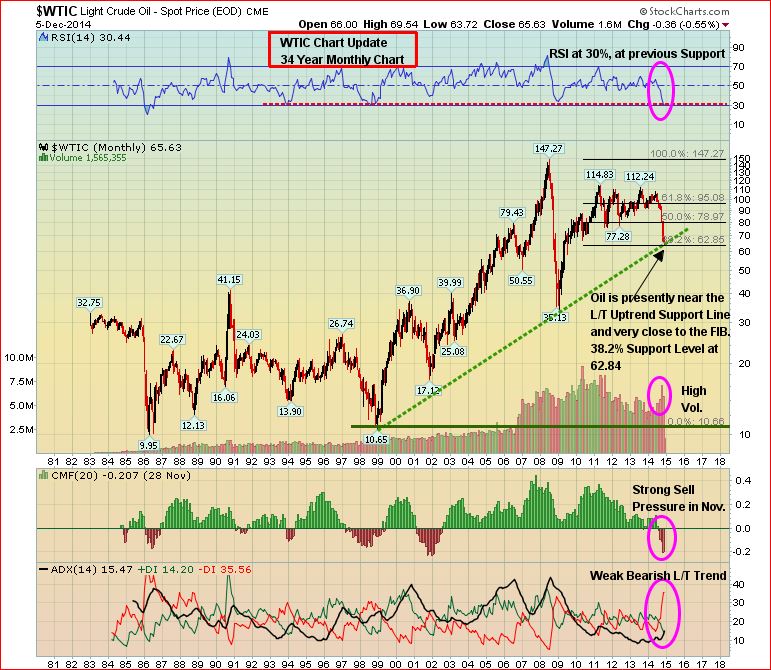
Morgan Stanley today lowered its forecasts for Crude Oil prices for the next 5 years, reiterating some concerns that supplies will likely keep prices down for an extended period with peak oversupply expected during Q2 2115…for its base case scenario, the U.S. bank sees Crude averaging $70 per barrel during 2015, down nearly 30% or $28 from its previous forecast…the bank sees prices gradually recovering to an average of $100 per barrel in 2017, just $4 below where it had the price in its previous forecast…
Technically, this 34-year WTIC chart from John shows something quite normal from a long-term perspective – a retreat to uptrend support in the low $60’s in place since the bull market began in Oil in 1999…Fib. 38.2% support is also at $63…RSI(14) is currently at previous support and has dropped in similar fashion as it did in 2008…in a worst-case scenario for 2015, WTIC could potentially test a very strong support band between $40 and $50 if the $60 level doesn’t hold and global economic growth is weaker than expected…
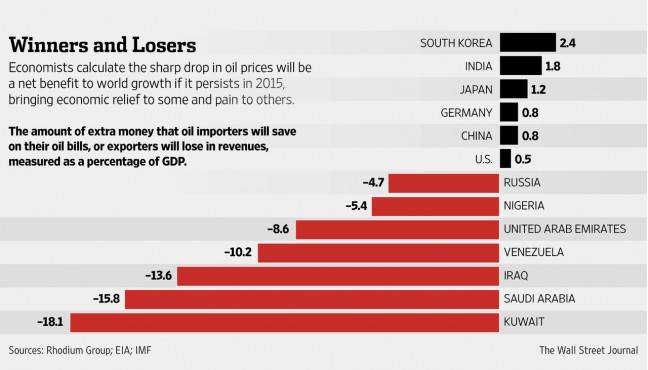
When it comes to Oil, there’s no better cure for low prices than low prices…for some countries, the plunge in Oil is going to cause considerable financial pain…for others, including the U.S., China, Germany and India, low prices will benefit consumers and give an overall boost to GDP…this should also lead to increased demand for Oil which in turn should help soak up the oversupply going through 2015…
Importantly, the IMF calculates that Oil’s plunge since the summer of this year could add nearly a percentage point to China’s GDP, and we all know how critical China’s economy is to the commodities space…
Venture Seasonality Chart
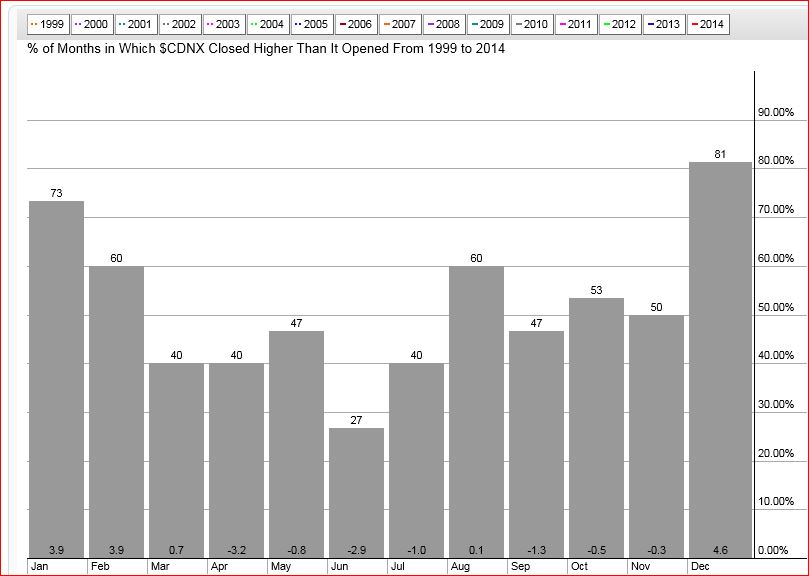
It might be a little difficult to appreciate this at the moment, but December historically is the best month of the year for the Venture with an average Index gain of 4% since 1999…typically, the Venture will experience some weakness during the first half of the month – especially in a “down” year – before rebounding sharply immediately before and after Christmas, a rally that often extends into January and February…
Below is an updated Venture “Seasonality Chart” covering the 1999-2014 period…based on historical patterns, there’s a strong chance the Index will put in a bottom sometime this week…
Venture 4-Month Daily Chart
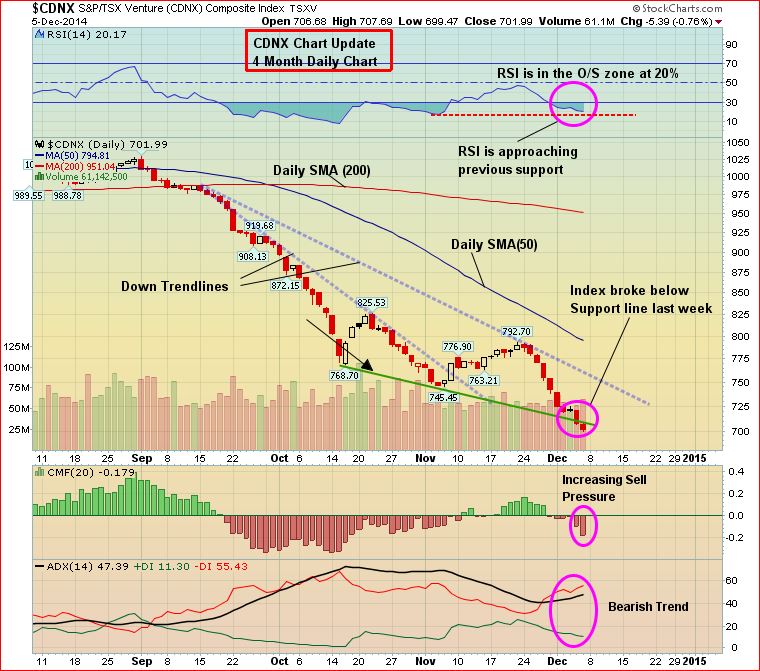
While the Venture is at a new multi-year low this morning, RSI(14) is approaching previous support on this 4-month daily chart, and doesn’t seem likely to reach the same oversold level it hit in October…such a scenario would represent a bullish divergence between RSI(14) and price, laying the groundwork for a reversal in the Venture beginning prior to Christmas…
In the meantime, happy bargain hunting – this is not weakness to be fearful of…
Venture 10-Year Monthly Chart
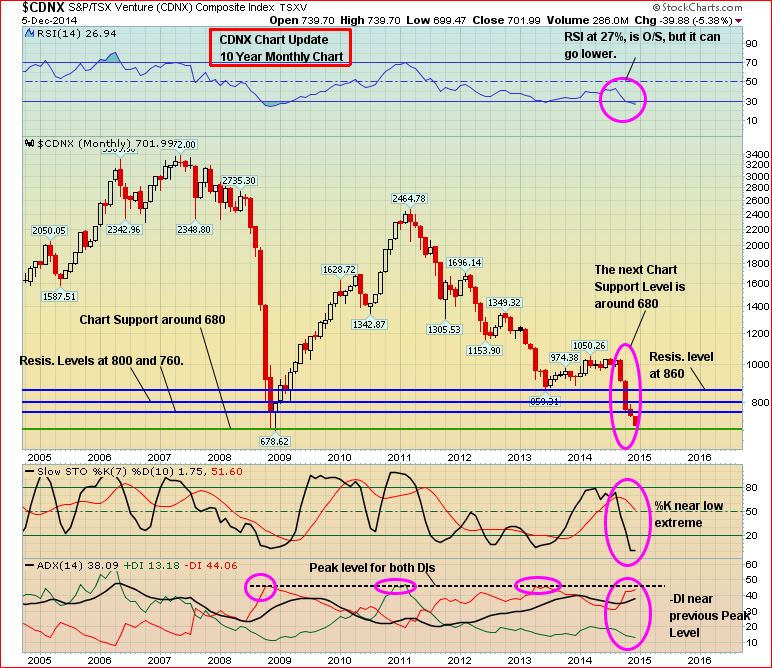
This 10-year monthly chart provides some hope that the Venture is very close to a turnaround as it closes in on the 2008 Crash low of 678.62…
You’ll notice on this chart that the -DI indicator is very close to the peak levels achieved in both DI’s at critical highs and lows since 2008…in addition, the %K indicator is now even lower than it was at the depths of the 2008 panic…
If you stretch an elastic band enough, it’ll snap – what’s happening here is that the Venture is being stretched to such extreme oversold levels, it may suddenly “snap” and react in a sudden and powerful way to the upside…
It’s no coincidence the Venture’s weakness since September has come at a time when the U.S. Dollar Index has surged higher, almost in parabolic fashion…the Dollar Index may have a little further to run but its current overbought current will need to unwind at some point in the near future, and that’s when the Venture should gain traction…
Discovery Ventures Inc. (DVN, TSX-V)
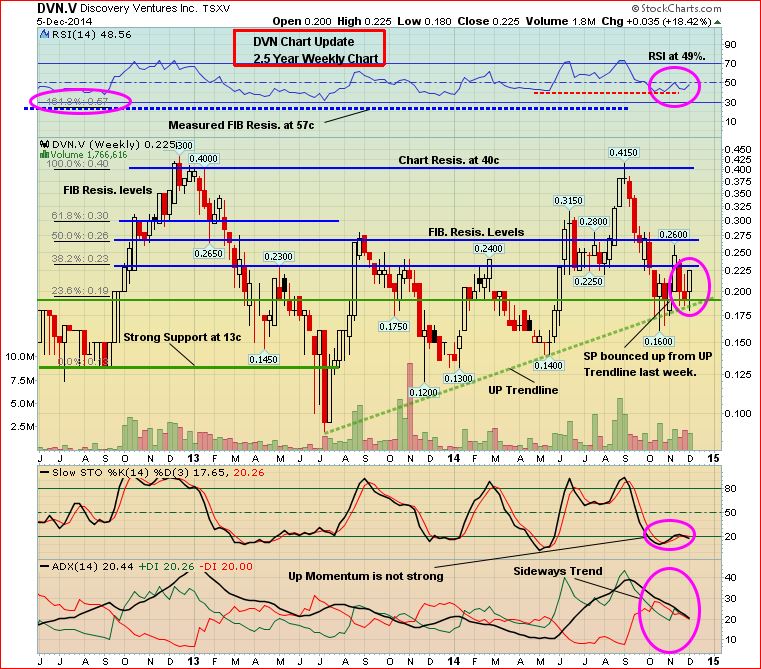
One of the few Venture stocks up since the end of October, and doing good volume, is Discovery Ventures (DVN, TSX-V) which has found excellent support at an uptrend line in place since last year as you can see on John’s 2.5-year weekly chart…
DVN continues to advance its high-grade Willa-Max Copper-Gold Project in southeastern British Columbia, and now has permitting to conduct an underground percussion drilling program to take samples from the Willa resource…keep in mind that a company like Discovery, pushing to go into production over the next year or 2, stands to benefit significantly from a weak Canadian dollar and lower Oil price environment…
DVN is off 2 pennies at 20.5 cents as of 7:30 am Pacific…
Silver Short-Term Chart
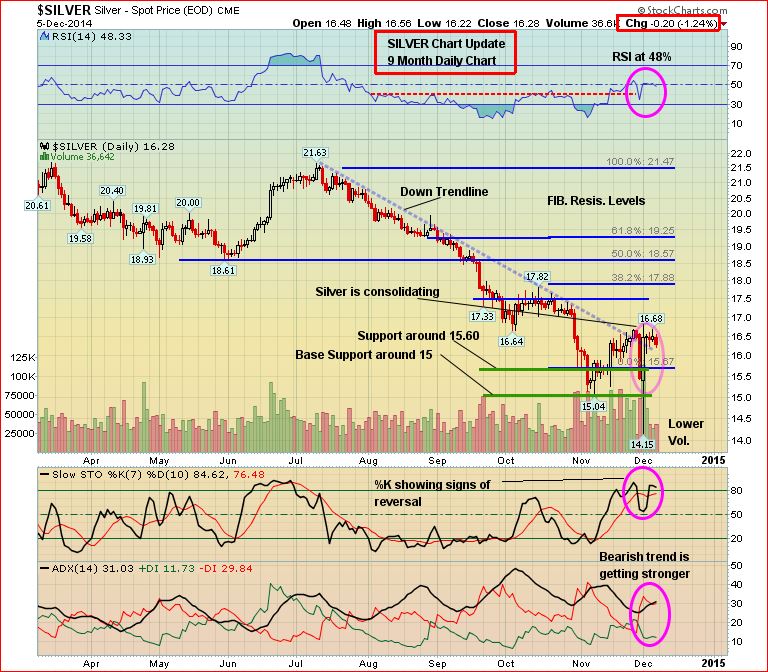
Encouragingly, Silver is finally gaining traction above a downtrend line in place since the early summer…last Monday’s dramatic move from an intra-day low of $14.15 to a close above $16 was technically highly significant…Silver is currently consolidating for a potential run at the $17.50 resistance area…superb support has been demonstrated at $15…
Silver Long-Term Chart
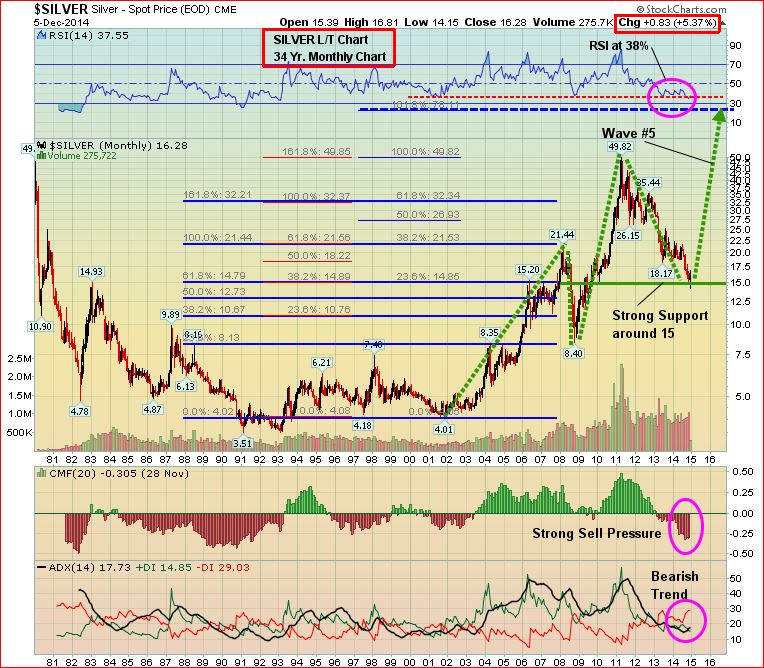
This 34-year monthly chart continues to give hope that Silver could be preparing for a powerful “Wave 5” move to the upside, though we caution that this could take some time to play out (if indeed this theory is correct)…
RSI(14) is at previous long-term support and this will need to hold along with key support in the immediate vicinity of $15…
Fundamentally, Silver has been hurt by a slowdown in global economic growth…if economies in the euro zone, China and Japan can show some fresh strength in 2015, the Silver price could begin to accelerate rapidly…
Note: John, Terry and Jon do not hold share positions in DVN.

10 Comments
The Venture – Nice and slow. Bring that elevator to the basement. Not to fast now, don’t bang the elevator on the basement floor and hurt the people inside.
Lets see if we get a big reversal on the Venture now after today now that it has dropped down to the previous low of 678 to make a double bottom. I think so, because it is overdone i.e oversold and I think the bulk of Tax loss selling is done and the only reason there is downward pressure on Gold to begin with is its priced in US dollars which have been on a tear mainly because of fabricated numbers to save their economy and retain their status. Eventually I believe the truth shall prevail.
At 3 p.m. the double bottom in Venture. Well, is this the end. Did the elevator hit the basement.
The earliest date that the venture started its uptrend was on Dec. 9th in 2004. What is interesting is that the low that year was Dec. 8th. This is the 8th and a double bottom was put in. GOING UP ANYONE.
I warned these guys about the fundamentals… and they brushed it off a couple month ago citing technicals…. fundamentals first whne bargain hunting boys!
GOLD 1219$$$.
If the jobs report and the surging dollar could only knock Gold down $13 an ounce Friday, you know there’s something big brewing here. $1,220 is the key area, need a confirmed breakout above that level on a closing basis. Looking good. Could be some major scrambling coming up among the shorts in Gold. Silver up nicely as well this morning.
1230$!!!….the juniors may finally wake up….also, wondering about the Double B on the TSX-V….
This will flow into the juniors, Steven, but the momentum may not really pick up until we get closer to Christmas…if Gold can confirm a breakout above $1,220, and stay above that level, this could set up quite a substantial move in the best juniors going into year-end and the beginning of 2015…Oil has been hurting the Venture but Gold and Silver may come to the rescue…
it was not a double but a triple bottom dating back to 2000-01 bottom of 650 ish was seen on Dec 18th-19th. We have recovered to $695. The big question is now do we see a lower high at $1500 on the CDNX. 2007 high was $3500 2011 high was $2500.. maybe the 2016-17 high will only be $1500..