Gold got as high as $1,648 overnight but has pulled back…as of 6:20 am Pacific, the yellow metal is up $6 an ounce at $1,638…Silver is 19 cents lower at $29.75…Copper is flat at $3.49…Crude Oil is down 87 cents at $101.37 while the U.S. Dollar Index has gained one-quarter of a point to 81.29…Dow futures are pointing toward a slightly lower open this morning…
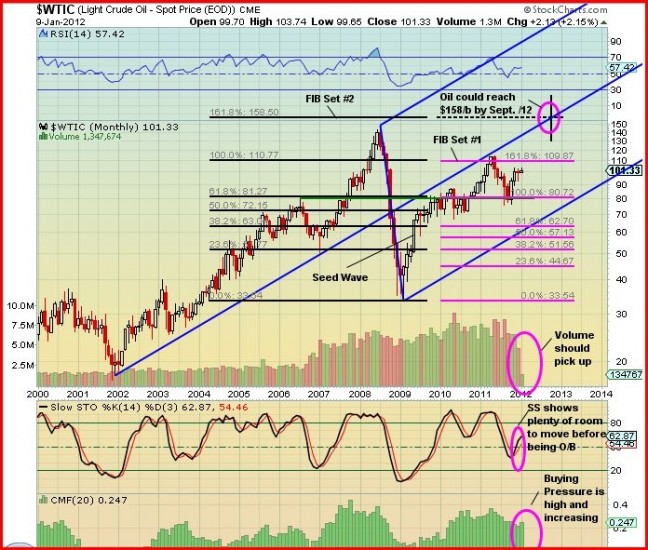
$100+ oil is likely here to stay, and one cannot rule out a rather dramatic spike in crude oil prices given fundamental factors (tight demand/supply structure, Iran) and technical considerations as the chart is quite powerful…this has the potential of adding to the volatility in equity markets and making oil a big issue in this Presidential election year…below, John has an interesting 14-year monthly WTIC chart that suggests another move to $150 a barrel cannot be ruled out…
John: The purpose here is to look at past and present trends and extrapolate to produce a probable future price estimate using Andrew’s Pitchfork , 2 Fibonacci Sets and the determination of Elliott waves.
First, the Pitchfork is placed on the chart with Point #1 secured at the 2001 low point and Points #2 and #3 at the high and low of the price range at the time of the crash in 2008/09. Remarkably the centre line joins the points of the low in 2002, the low in 2007 and the high in 2011.
There is strong support at the $80 level (green line). The position of the seed wave for the FIB Set #1 (mauve lines) starts at the low in 2009 (0%) and spans 13 months which takes it from $33.54 to $80.72(100%). The 161.80% level to find the top of Wave #1 shows $109.87 which is very close to the high of 2011.
FIB Set #2 uses the FIB Set #1 161.80% level as its 100% and the FIB Set #2 extension to 161.80% to find the end of Wave #3 which is at $158.50. Projected across to the centre line of the Pitchfork, it shows this could be the price of oil in September, 2012. The SS and CMF indicators also support a future rise in the price of oil. The bottom line is that the trend is bullish.
The Venture Exchange has now posted gains in 11 out of the past 12 sessions after yesterday’s 15-point jump to 1542…the climb over those 12 sessions has been 7%…a major area of resistance will be an earlier support level of 1575 which is also the current 100-day declining moving average (SMA)…a test of support at 1500 should be expected as the month wears on…daily Stochastics(14) are firmly in overbought territory at the moment (at the November, July and April peaks)…
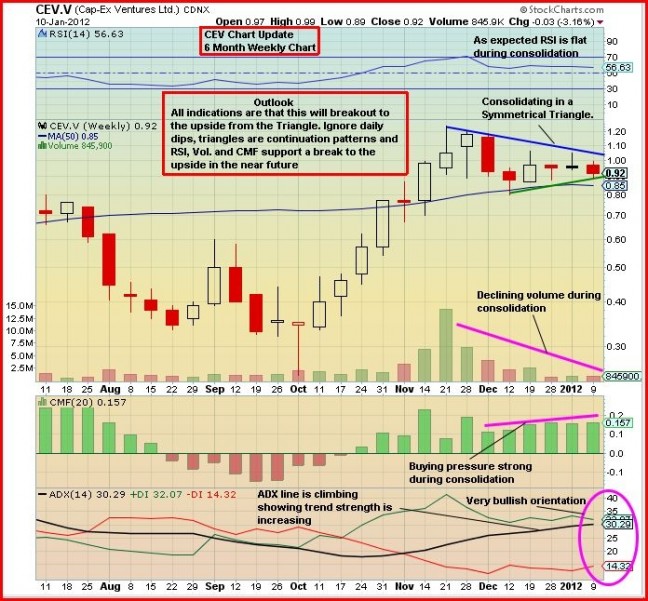
Cap-Ex Ventures (CEV, TSX-V) is expected to close its $10 million financing by early next week with more news from the company’s iron ore discovery near Schefferville expected in the near future as well…technically, the stock continues to look strong – it has been consolidating in a symmetrical triangle since mid-November – as John’s chart shows below…
Note: Jon continues to hold a position in CEV (John and Terry do not).
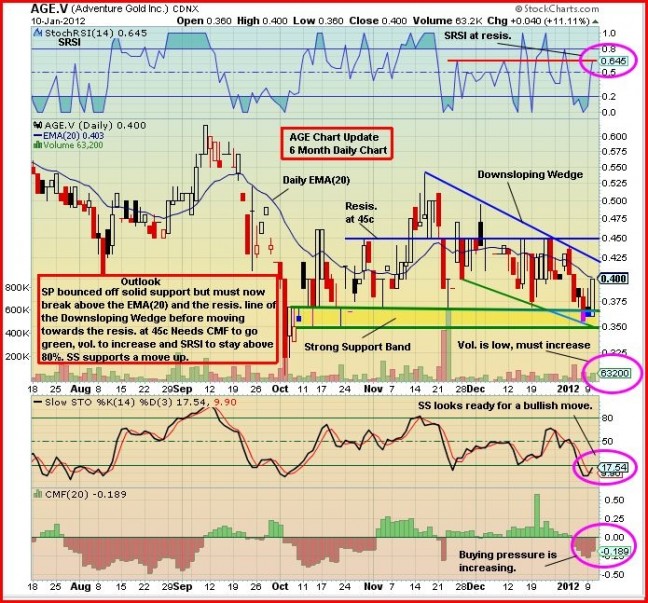
Adventure Gold (AGE, TSX-V) continues to be one of our favorite long-term opportunities…it was very encouraging to see the company was able to raise $1.7 million at the end of December on a non-flow-through basis and above the market price…the financing was completed at 45 cents…AGE closed yesterday at 40 cents…the declining 100-day SMA at 44 cents does provide short-term resistance but the best approach with AGE in our view is to simply tuck it away for the long haul…AGE has made great progress over the last year with its Pascalis-Colombiere Gold Property adjacent to Richmont Mines‘ (RIC, TSX) Beaufor Mine, plus the company has numerous other projects in the pipeline…John’s chart shows a likely continuation of recent trading patterns over the short-term with strong support in the mid-30’s and significant resistance in the mid-40’s…we expect a stronger second half of the year for AGE (and the market as a whole)…
Note: John, Jon and Terry do not currently hold positions in AGE.


7 Comments
Thanks John for these charts, especially CEV and AGE – very much appreciated. (I do have AGE tucked away) 🙂
You might want to update cjc, YIKES! 🙂
Is it possible that cjc has bottomed out and are ready to bounce back to mid 40’s.. Yesterdays slaughter must be a sign that investors are panicking a lot…
Hello Kalkan – CJC seemed to have found support at .36. Looks like the drop since last Wednesday was possibly orchestrated and brought on the selling out of fear? Then, it could still be manipulated and drop at the close, maybe .38 so it will still have been a green day! 🙂 Latest rumour is copper in one of the last holes!
Hi Andrew. Yes it looks like it has found strong support. Have to keep myself updated here. I think we will see .50-.60 again before news..
Yes, nice close after all, I’m mostly out of CJC but I’m tracking it incase I should take a position again. CEV did make a double bottom (.87) which held so its looking good. Have a good evening!
Yeah I got out this monday and took position in seafield, sff, I thought the news would bring it to at least .20 but my luck didn’t work there. I will see what happens in cjc tomorrow, maybe time to jump on that train again. Cev is also interesting at this level. Have a nice evening you too.