Gold continues to trade in a narrow range…as of 5:15 am Pacific, the yellow metal is off $2 an ounce at $1,611…Silver has dropped 16 cents to $27.88…Copper is down a penny at $3.40…Crude Oil is up 20 cents at $93.55 while the U.S. Dollar Index has climbed one-third of a point to 82.63…
Gartman Predicts Gold Will Break Out To The Upside
“The range in which Gold is trading is growing ever tighter – the lows are higher and the highs are lower”, commodities trader Dennis Gartman told CNBC yesterday…in other words, the bulls and the bears are closing in on one another and an important final battle is imminent…“Ultimately I think bulls win,” said Gartman…“I think Gold will break out to the upside”…
Kinross Reports Earnings, Takes Aim At Cutting Costs
On the heels of major cost escalation in the Gold sector, Canada’s third-largest Gold miner (Kinross Gold, K-TSX) said last night it’s launching a sweeping cost-cutting campaign to improve its cash flow…the announcement comes after a warning last week by Barrick Gold Corp (ABX, TSX) that a key mine it’s building in Chile will cost billions of dollars more than originally projected…new Kinross CEO J. Paul Rollinson stated, “Given rising costs, I believe we need to get back to the fundamentals of our business…to that end, I am launching a company-wide cost reduction initiative aimed at improving capital efficiency, reducing costs and increasing margins…this may require tough decisions in a number of areas to ensure that we maximize free cash flow and shareholder returns”…Kinross has reported adjusted net earnings of $156 million of 14 cents per share for the second quarter of 2012 vs. $222.6 million or 20 cents per share for the same period last year…as a result of the company’s disposition of its 50% interest in Crixas, it now expects to produce approximately 2.5 million to 2.6 million Gold equivalent ounces in 2012 from its continuing operations, compared with its previous forecast of 2.6 million to 2.8 million Gold equivalent ounces…cost of sales for 2012 is now forecast to be $690 to $725 per ounce, compared with the previous forecast of $670 to $715, due to higher forecast production cost of sales per ounce in west Africa and South America…
China Data Fuels More Stimulus Hopes
Data released today by the world’s second-largest economy showed the slowdown that’s been underway since late last year hasn’t reversed just yet…China’s Shanghai Composite finished up 0.6% overnight after data showed inflation fell to a 30-month low while industrial output and retail sales both slowed in July…markets are cheering the fact that a decline in inflation to 1.8% gives Beijing more room to use both fiscal and monetary tools to prop up growth…since the start of June, the central bank has cut interest rates twice, state planning officials have accelerated approvals for investment projects, and a series of local governments have announced large spending plans…most analysts anticipate these measures will spur a recovery, and are expecting stabilization by next month and a more pronounced upturn in the fourth quarter…but the strength of this recovery is expected to be much milder than the rebound China experienced in 2009 when the government pushed through a nearly $600 billion stimulus program…that spending binge ultimately created stubbornly high inflation and a surge in local government debts, so Beijing has been much more reluctant to launch a similarly big stimulus this time…
Potential For Food Crisis Grows
The world could face a new food crisis of the kind seen in 2007-08 if countries resort to export bans, the UN’s food agency warned today, after reporting a surge in global food prices due to a drought-fueled grain price rally…a mix of high oil prices, growing use of biofuels, bad weather, restrictive export policies and soaring grain futures markets pushed up prices of food in 2007-08, sparking violent protests in countries including Egypt, Cameroon and Haiti…concern about extreme hot and dry weather in the U.S. Midwest sent corn and soybean prices to record highs last month, driving overall food prices higher again and reversing the Food and Agriculture Organization’s expectations for steady declines this year…
Today’s Markets
Asian markets were strong overnight with China’s Shanghai Composite gaining 13 points to 2171…European shares are off slightly this morning while stock index futures in New York as of 5:15 am Pacific are pointing toward a flat to slightly negative open on Wall Street…the Venture Exchange closed at 1186 yesterday, right at its 10 and 20-day moving averages…
Osisko Mining (OSK, TSX)
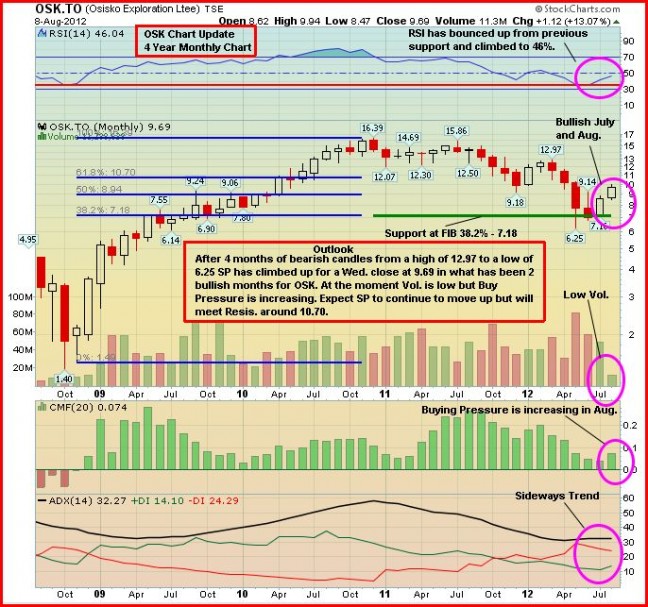
Osisko Mining (OSK, TSX-V) has rebounded strongly over the last couple of months, and yesterday the company reported record monthly Gold production of 37,780 ounces from its Canadian Malartic Mine in northwest Quebec…the average grade milled was 1.02 g/t Au while average recovery was 88.6%…Sean Roosen, president and chief executive officer of Osisko, commented, “We are now beginning to see significant improvement in daily throughput and Gold production from the Canadian Malartic mill…in the month of July, Canadian Malartic achieved another Gold production record of 37,780 ounces…with the now-completed precrushing circuit and the coming installation of the second pebble crusher in early fourth quarter, we will be focused on plant optimization and cost reduction…since we started production last year, Canadian Malartic has now produced well over 400,000 ounces of Gold during this ramp-up phase”…after falling briefly below $6.50 per share in May, OSK is approaching the $10 level again after gaining exactly $1 per share to $9.69 over the last three trading sessions…below is a 4-year monthly OSK chart from John…
Rainbow Resources (RBW, TSX-V) Chart Update
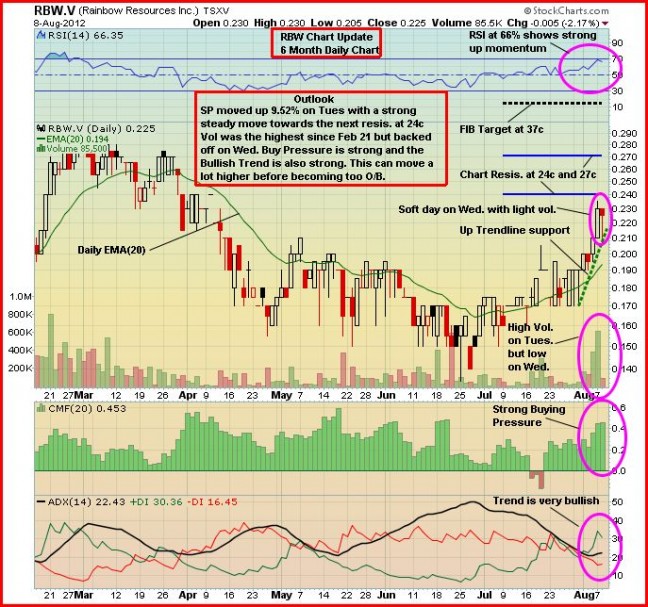
Rainbow Resources (RBW, TSX-V) continues to look very strong, with the half penny drop yesterday healthy from a technical point of view…selling into a normal minor pullback (on lower volume) like yesterday, when the primary trend is up, is a mistake many traders make with a stock in general…RBW is expected to start drilling at its International Silver Property within the next few days, and anything can happen once that drill starts turning – especially in this case when Rainbow is taking direct aim at a very promising high-grade, near-surface structure…below is a 6-month daily chart from John that shows continued strong “up” momentum and a pronounced trend…the 50, 200 and 300-day moving averages (not shown in this chart) are all in bullish alignment…
Canamex Resources (CSQ, TSX-V)
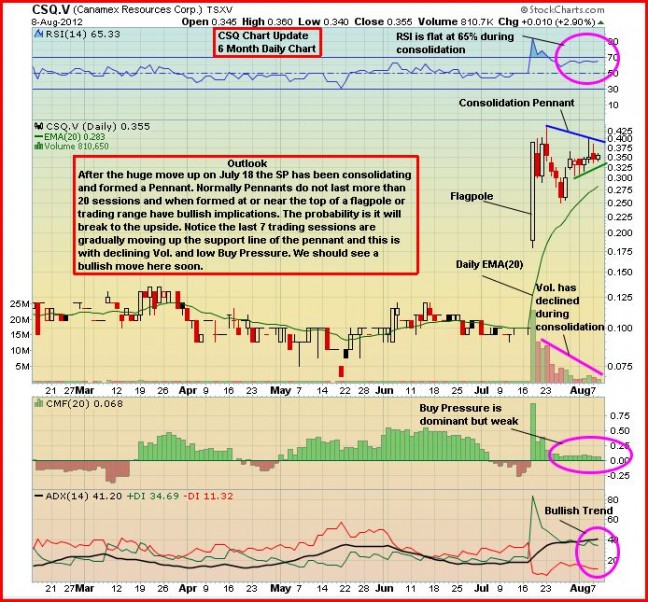
Canamex Resources (CSQ, TSX-V) reported a terrific drill result from its Bruner Property in Nevada July 18 (4.08 g/t Au over 118.1 metres) with the stock climbing as high as 44 cents from the 10-cent level on huge volume…it pulled back, as we had anticipated, into the mid-20’s to cleanse an overbought condition…it has regained strength over the last week or so, and the company has also announced a fully subscribed private placement for $2.7 million at 27 cents…below is an updated CSQ chart from John that shows a bullish consolidation pennant – this one definitely needs to be watched closely in the weeks ahead…
Note: John and Jon both hold share positions in RBW. John, Jon and Terry do not hold positions in OSK or CSQ.


29 Comments
Some may say, but you were so positive on RBW a while back, i agree,
but Jon asked me to be positive, so i obliged… May i add, i am still
very positive, but RBW needs to get their act together. We need to
see more than the boss holding that rock, which no doubt looks good,
but looks are deceiving.. Was it an illusion ? or did he have it assayed.
Should investors be expected to buy because of a rock, which, if it was
silver, would only be worth, say $25.00. Show us the beef RBW….
RBW
The truth has to be told & it wouldn’t surprise me if our buddy Dave, might
be right after all. I just checked the chart on RBW & over the shorter term,
it don’t look that good. All indicators that i check, are showing as being
overbought, all except the RSI that is, which is close. Yesterday’s candle
is negative & would you believe, because someone took my offer of 0.225 at
the end of the way, was the reason, it didn’t close at it’ low for the day. R !
Appreciate your insight as always, Bert, but truth be told…some very shiny drill core is about to be pulled out of the International…focus on the big picture, my friend, which is one of the best looking charts on the Venture, and a 1-2-3 bang-bang-bang rock ‘n roll show with the International, Gold Viking, and Nevada…many investors jumped off the train too early with GQC…don’t make the same mistake with RBW.
Jon
Good morning Jon, i am talking about the shorter term & it’s Bert’s chart readings
versus Johns’. Soon the champ will be crowned… Sorry John, but you trained me well.
R !
Big sell off this morning of GQC… see how market reacts to this selling!
Not sure what u mean by big sell-off…lots of buyers around who will gladly soak up any loose shares in GQC…solid as a rock. Decent results from UGD have just come out, we’ll see how the market reacts to that.
Someone is creating a panic there…. 1000 lot was taken out in the last minute!. It happened once already recently…. Testing the market response!
If you have a look at rbw’s weekly candle chart, you will notice that the indicators are just now starting to turn bullish. Great sign imo!!
GQQC, perhaps the problem for them is that the PP does not close until Aug. They do not want problems with the exchange. richard l
Sorry Aug 21 off top of my head. richard l
RBW Smartstox interview coming up next week, as per their website.
bert, 60 on rsi isnt really “close” to being ovbought…
p.s. yesterdays candle was indecisive not negative…
News out; International strike extended to 7km
rainbowresourcesinc.com/pdfs/RBW%20Aug.%209%20NR%20.pdf
If RBW is starting to drill, I assume they got their drilling permits
DB
I stated that the indicators i look at were showing overbought, except
the RSI, which is close. John may be proclaimed the winner anyway, only
because of the luck of the draw, that is, NEWS today. R !
The drop of RBW to 20 cents … not surprise or worry… In fact, I lodge my buy at 20 cents hoping to scoop more. Low volume, the price adjustment is only small individual sell off. It will recover before the market closes today. Let us see!
Very interesting news on the potential new strike length – this (7 km) goes well beyond what was previously known. This will march right back up as drilling begins.
Here is the Presidents Q2 report also issued today. Lots of news coming out now that they have the drilling permits!!
rainbowresourcesinc.com/pdfs/RBW-Presidents-Q2-Report-080912.pdf
@ Bert; Check out RBW’s fact sheet. You will note they have assayed some of those rocks and they’ve returned results as high as 1148 g/t Ag.
rainbowresourcesinc.com/pdfs/RBW-Fact-Sheet-080212.pdf
Alert going out to our readers by this evening or first thing in the morning on RBW, after more review of the NR and a short discussion with Johnston (he’s agreed to an interview later today). This geophysical data is apparently phenomenal with very strong signatures well north and well south of the Cabin-Forgotten (a 1.2 km surveyed vein system) areas. Previous scenario was maybe a 4 km strike length. Six “high-priority” locations to be immediately investigated, up and down this trend for 7,000 metres. Johnston said he’s also had an inquiry from a major U.S. newsletter writer – this is going to get a lot more interesting in a hurry IMHO.
Made an RBW purchase at 0.21.
Alexco taking a beating any thoughts.
Richmont’s new CEO Paul Carmel just purchased another 10,000 shares in the open market between $3.66 – $3.68
any comments from BMR on how this stock might be at it’s bottom FINALLY?!?!
Anyone know why the venture is up 8% near end of trading today?
Great Close for RBW today!!
Good show RBW… thanks dumping at 20 cents and today’s performance as I predicted… nice recovering to close at 23.5 cents. Don’t be upset if you have sold today at 20 or 21 cents. @Alexandre… good for you also! GQC … nice adjustment after so much accumulation in share price. The rising mode is not over yet. The stock may have another 10% adjustment before heading up to 17 cents level. GBB ‘s 80 cents buy lot will be filled very soon … scoop at 7 cents not 8 cents!
GBB… I mean 8 cents in my previous comment …not 80 cents…. those were the days!
BMR – Can you find out what bin sizes they have used for their geophysic survey? This will tell me the confidence on the signatures.
Oil and gas normally use bin sizes anywhere between 15-50m depending on depth and they still struggle hitting oil or gas. Granted, metal signatures are quite different from petroluem. Nonetheless, the larger the bin sizes the greater the uncertainty.