Gold has traded between $1,662 and $1,676 so far today after posting its first weekly advance since November…as of 7:15 am Pacific, the yellow metal is up $4 an ounce at $1,667…the $1,672 level would be an important near-term level for Gold to cross on a closing basis as that’s the EMA-20 and a down trendline on the 6-month daily chart as John pointed out over the weekend…Silver is up 41 cents to $30.85…Copper is flat at $3.63…Crude Oil is off 36 cents at $93.20 while the U.S. Dollar Index is relatively flat at 79.58…the dollar has hit a 10-month low versus the euro…Federal Reserve Bank of Chicago President Charles Evans said the U.S. should keep policy accommodative (see below) to support the economy…
Today’s Markets
Japan’s financial markets were shut for a public holiday but China’s Shanghai Composite surged 3% or 69 points overnight to close at 2312…China’s fourth quarter economic growth is due Friday, and a Reuters poll shows it may have quickened to 7.8% which would snap seven straight quarters of weaker expansion…there is ample evidence that China is on the rebound, and as John showed the Shanghai last month broke above a down trendline that had been in place for nearly two years (the same is about to occur, it seems, with the Venture)…Bloomberg reported that traders were excited today by comments from Guo Shuqing, chairman of the China Securities Regulatory Commission, who said the country could increase tenfold the size of two programs that allow investors to buy securities on domestic markets…European shares are off their session highs in choppy trading, while the Dow is down 16 points as of 7:15 am Pacific…the TSX is up 17 points to 12619 while the Venture Exchange is up a point at 1241 after touching 1247 in the opening minutes…1240 is important resistance as we have pointed out…a couple of consecutive closes above 1240 on increased volume would certainly be bullish for the Venture…investor patience with this very “slow moving train” at the moment is important…
Detailed Venture Chart
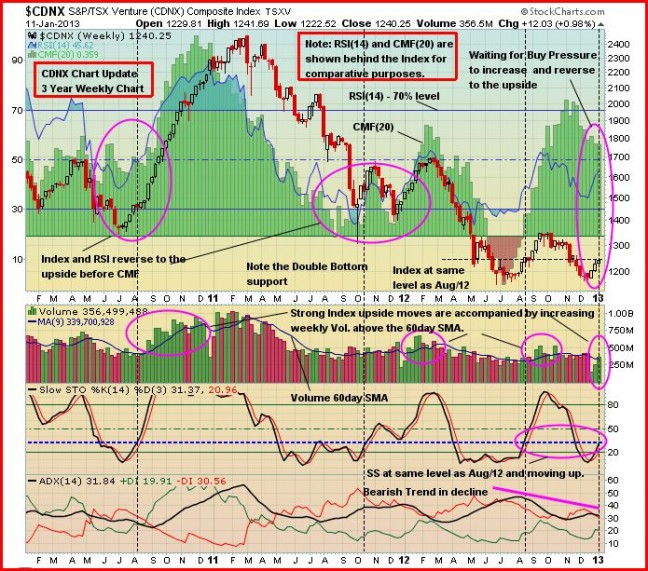
The construction of John’s 3-year CDNX weekly chart below is different from the usual in that the indicators RSI(14) and CMF(20) are placed behind the Index for comparative purposes and the weekly volume indicator is separate from the chart instead of being an overlay for reasons of clarity…the main purpose of this chart is to determine where the Venture is in its cycles and what we can expect in 2013…
When examining a chart, the first items to look for are patterns, especially with regard to support and resistance…on the chart below we see a double bottom formed in June/July and December, 2012, creating a strong base…this base is essential to support any sustainable move to the upside…next, look at the 3 mauve loops…each one shows that RSI(14) and the Index reverse before the CMF(20)…at the present time both the Index and RSI have reversed but CMF has shown no upside move…
On the volume indicator, the first 3 loops show that strong Index moves are accompanied by increasing weekly volumes above the 60-day SMA…it’s interesting to note that last week’s volume of 357M is close to the level at the start of the bullish move in August, 2010…also, the saturation volume occurred around 1 billion shares in February, 2011…thus, there is plenty of room for a volume increase to support a move up…
The Slow Stochastics, a momentum indicator, shows that up momentum is increasing and the %K is at the same level of 31% as it was in August, 2012, when the Index was also at 1240…
The ADX trend indicator always lags momentum indicators because it takes time to establish a trend…we see that both the -DI and ADX(line) are in decline, showing that bearishness is dissipating…
So where does the CDNX stand at the moment?
1. Both RSI and Slow Stochastics have reversed and show increasing up momentum – bullish;
2. Index has reversed and held the up move for the last 3 weeks – bullish;
3. Volume has increased in each of the last 3 weeks and closed last week above its 60 Day SMA – bullish;
4. CMF has not reversed as yet, but as shown it usually lags the momentum indicators…watch for an increase which will mean that more money is flowing into the CDNX – bullish;
5. There has not been a +DI/-DI crossover on this 3-year weekly chart yet to indicate a trend reversal – watch for it.
The above explains why we are bullish regarding the CDNX for 2013 and as this first quarter progresses…another important factor to consider (not shown on the chart) is the reversal to the upside during the fourth quarter last year in the 1,000-day moving average (SMA), an event that typically indicates a major trend change…
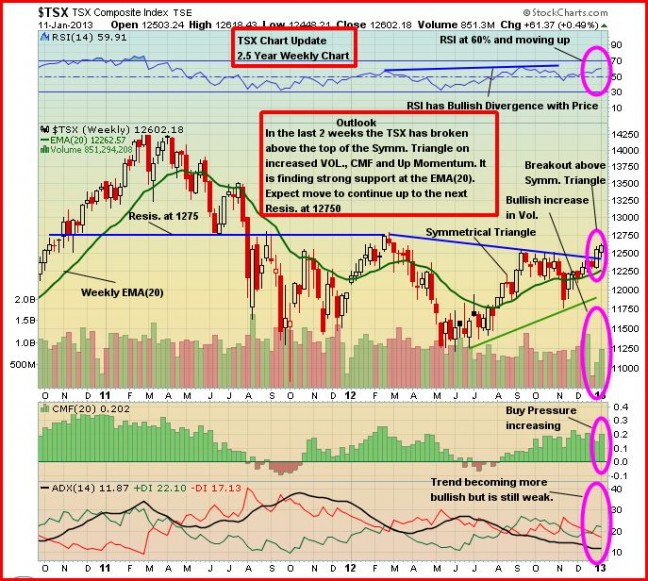
TSX Chart Update – Breakout Above Symmetrical Triangle
We’ve been watching for this event for a while, and it just recently occurred – the TSX has broken above a symmetrical triangle which is clearly a bullish development…the Index closed Friday at 12602 and now appears poised to take a run at the early 2012 high of 12789…
6.5% U.S Unemployment Level Not Likely Until Mid-2015 – Evans
The U.S. economy is expected to grow by 2.5% in 2013, improving to 3.5% growth in 2014, top Fed official Charles Evans said today…he also forecast the U.S. unemployment rate would be 7.4% this year, easing to about 7% in 2014…”One good indicator of labor market improvement would be if we saw payroll employment increase by 200,000 each month for a number of months…we’ve been averaging about 150,000, but it’s been very uneven…we need a higher pace of employment growth and less volatility in that pace,” he said…the creation of 1 million jobs over six months would be a “substantive” improvement, but bringing unemployment down to the key level of 6.5 percent was likely to take much longer, probably until mid-2015, he said, speaking at the Asian Financial Forum in Hong Kong…the Fed’s decision last year to tie monetary policy to specific economic conditions should help boost the recovery without letting inflation take hold, said Evans, a chief architect of the policy…it also provides additional accommodation by assuring markets that rates will remain low even after the economy perks up, he said…”Given more explicit conditionality, markets can be more confident that we will provide the monetary accommodation necessary to close the large resource gaps that currently exist,” he stated…”Additionally, the public can be more certain that we will not wait too long to tighten if inflation were to become a substantial concern”…
Silver Chart Updates – Short-Term & Long-Term
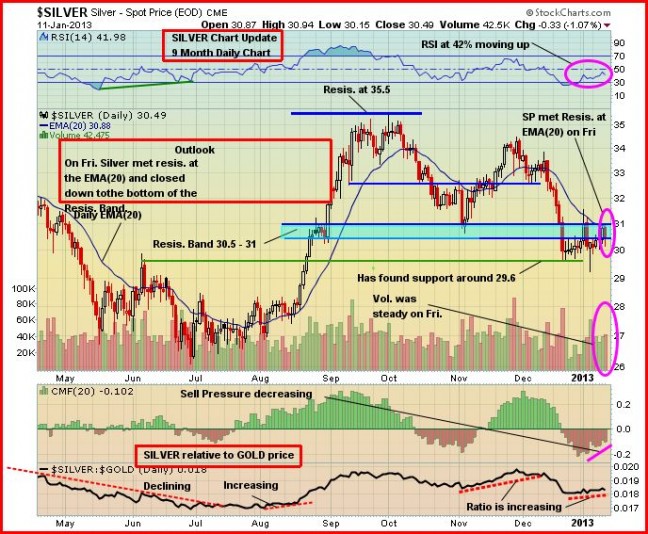
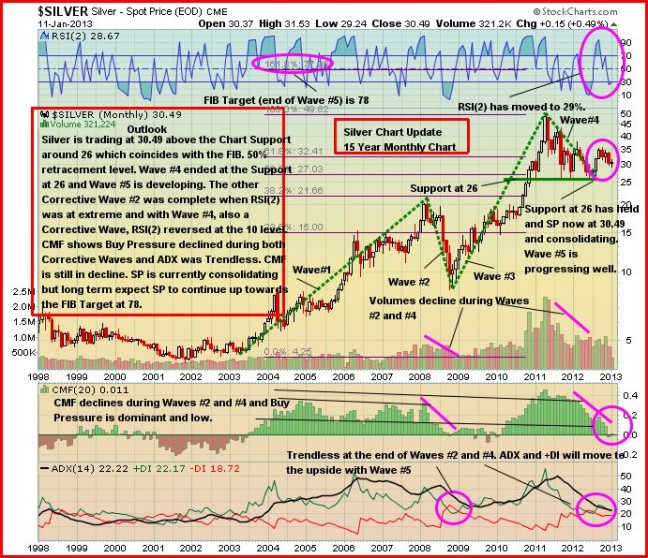
As usual, below are John’s Monday morning Silver chart updates…interestingly, the U.S. Mint sold a massive 3.9 million ounces of Silver in the first few days of 2013, already surpassing the entire December total of 1.64 million ounces…
Silver Short-Term Chart
Silver Long-Term Chart
One thing that is significant about this chart is the RSI(2) which is at one of its lowest levels in the past four years…we view this as a bullish sign for the balance of the first quarter…Silver has always proven to be primed for a strong move up whenever this indicator falls below 30 on this long-term monthly chart…
Probe Mines (PRB, TSX-V)
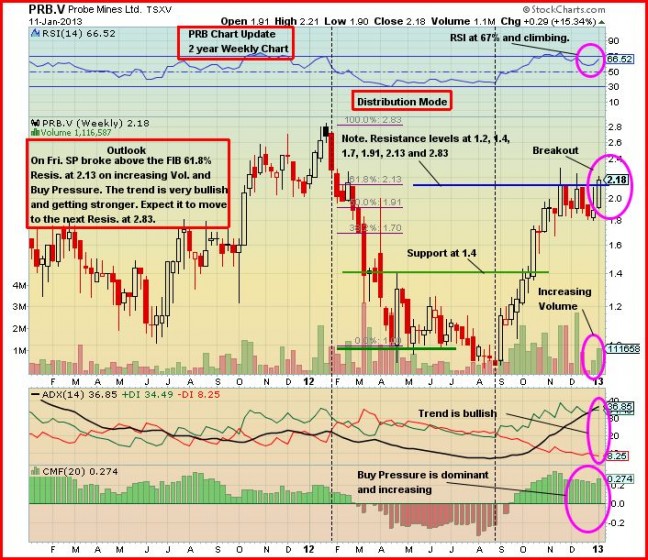
Probe Mines (PRB, TSX-V) continues to produce excellent results from drilling at its Borden Lake Gold Project near Chapleau, Ontario…the company’s most recent update came January 8…technically, Probe could be ready for a significant move higher in the near future given the look of this 2-year weekly chart…as of 7:15 am Pacific, PRB is up a penny at $2.19…
Note: John, Jon and Terry do not hold positions in PRB.

2 Comments
Volumes picking up in Greencastle, maybe this old dog will run again…
http://finance.yahoo.com/news/greencastle-provides-corporate-133000634.html
hey Jon/John… while it isnbt the close the CDNX gapped up and didnt hold the trendline… and has gone down since the open… assuming that whiler this the first try at it… is has been unsuccessful.
interpretation????? thx guys!