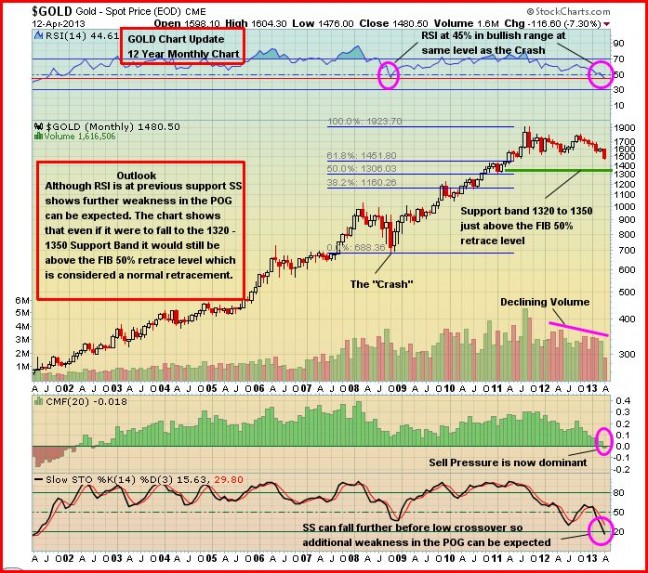
Gold is getting hammered again today with much of the selling due to technical factors after bullion breached critical support levels Friday…as of 7:20 am Pacific, Gold is off $78 an ounce to $1,398 after tumbling $84 an ounce Friday…this is almost like August/September of 2011 in reverse when Gold was making $50+ daily moves to the upside on its way to an all-time high…it’s unlikely, however, that the $1,400 area is a bottom…a 50% Fibonacci retracement from the high of just over $1,924 would be considered a normal correction, and that would bring bullion down to the low $1,300’s as John shows in the 12-year monthly chart below…whether the Fib. 38.2% level ultimately gets tested or not is anyone’s guess in these volatile markets, but the low $1,300’s seems a certainty at this point – how long that takes to play itself out is again impossible to predict…we live in a world, however, where markets can move violently very quickly as we all witnessed in 2008…Gold needs to find a bottom – ideally, the quicker, the better…
The negative mood surrounding Gold has been heightened by the news last week that Cyprus would sell Gold as part of its bailout…although the quantity of Gold involved is tiny in the context of the overall market, at roughly 10 tonnes, Gold traders fear other financially troubled euro zone countries could follow suit at some point down the road…Portugal, Italy, Greece and Spain – the so-called PIGS, are believed to hold a combined 3,200 tonnes of Gold with about 75% of that total in Italy’s hands…
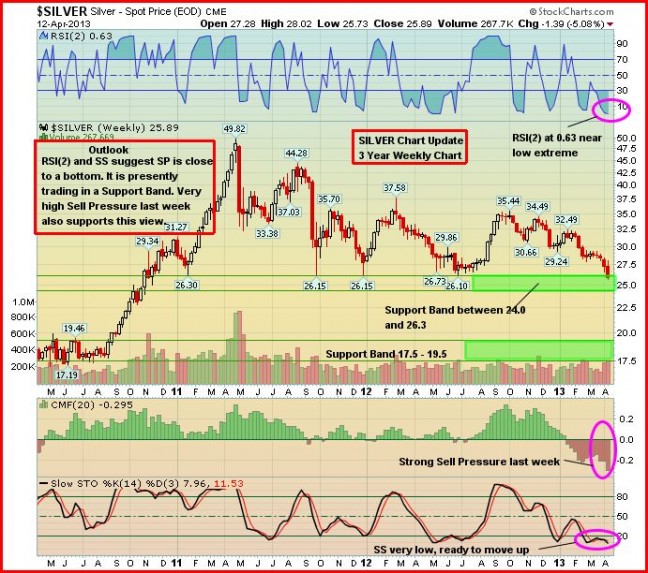
Silver is getting whacked again today as well…as of 7:20 am Pacific, it’s off $2.40 an ounce to $23.61 after dipping briefly below $23…John’s 3-year weekly chart below shows deeply oversold conditions and a support band between $24 and $26 an ounce…below that, the next major support begins at $19.50…
Silver Short-Term Chart
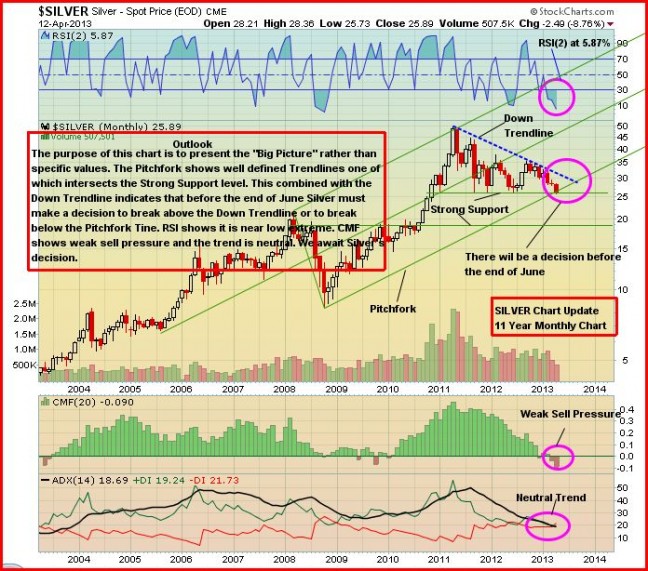
Silver Long-Term Chart
In recent weeks, John pointed out that Silver was approaching “decision time” and indeed it has broken below the “pitchfork” line as opposed to climbing above the down trendline in place for the past couple of years…RSI(2) shows extreme oversold conditions, though these could persist for a little while yet…Silver may ultimately have to test support around the $20 level before a bottom is put in…
Commodities are soft across the board today with Copper down 13 cents to $3.22 as China released a disappointing first quarter GDP number of 7.7%…the market was expecting an expansion of 8% which has led to a loss of confidence in the world’s second largest economy…”Slowing first quarter 2013 GDP growth despite massive credit expansion, much of it off balance sheet, spells bad, bad news for the Chinese economy”, stated Patrick Chovanec, chief strategist at Silvercrest Asset Management…when “exploding” credit growth is met by slower economic growth, this equates to a “dead end”, he added…Crude Oil is down nearly $3 a barrel to $88.55 while the U.S. Dollar Index is flat at $82.24…
Today’s Equity Markets
Will this be the week that the Dow and the S&P 500 finally run out of gas?…about a third of the Dow Industrials and 70 S&P 500 companies, across the banking, consumer, pharmaceutical, technology and industrial sectors, report earnings this week…investors will be mining those reports for any indication of what corporate America expects to see in the coming months, and whether it’s confirming expectations for a mid-year dip in economic growth…the Dow is down 85 points through the first 50 minutes of trading…the TSX, more sensitive to commodities, has lost 219 points (currently at 12118) while the Venture is now below the 1000 mark for the first time since early 2009…as of 7:20 am Pacific, the Venture has retreated 47 points to 975…Asian markets were weaker overnight…Japan’s Nikkei average fell 209 points to close at 13276 while China’s Shanghai Composite lost 25 points to finish at 2182…European markets are down just under 1% in late trading overseas…
The head of institutional portfolio strategy at Oppenheimer Asset Management, Andrew Burkly, told CNBC with regard to the big run-up in the Dow and the S&P, and the sell-off in commodities: “Commodities are representing another example of just how odd this lack of risk-embracing rally we’ve seen is…while stocks are at all-time highs, a lot of risk indicators are not participating”…Burkly sees that as a sign of trouble for the market, and it is paralleling a disconnect in high-beta stocks which have been lagging the broader market for the past several weeks…”It’s signaling deterioration…I would say, historically, it’s not been good for forward performance of the stock market…you’re seeing the same thing in the emerging markets, the under-performance of commodities…small caps are okay, but not great”, he said…
TSX Updated Chart
A technically disturbing fact regarding the TSX is that it has slipped below important support where some long-term moving averages (SMA’s) also converge…below is a 3-year weekly chart from John…the TSX is clearly in at least a temporary downtrend which potentially could result in a test of the November low just beneath 11800…the next Fibonacci support levels are at 12072 and 11907…
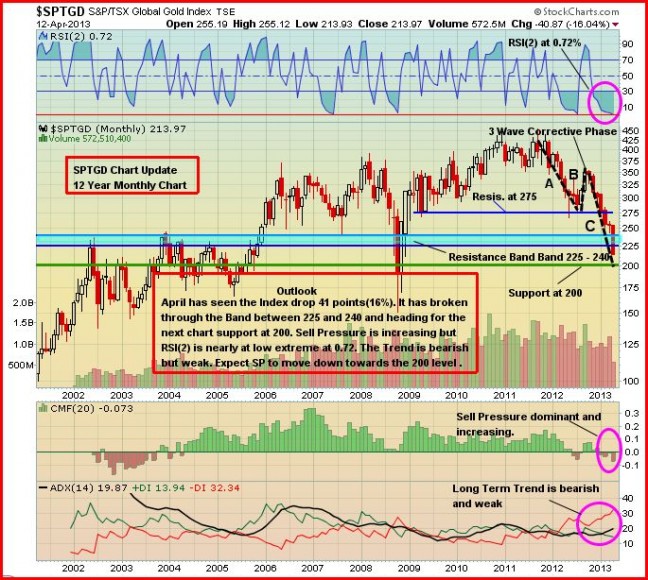
TSX Gold Index Updated Chart
The month of April has been devastating for the TSX Gold Index as it has fallen by more than 20% with this morning’s drop slightly below 200…there is some chart support at 200, so we’ll see if it’s able to close at or above that level today…the Gold Index is currently less than 25% above its 2008 Crash low when Gold was trading at half the price it is now…some incredible deals are going to emerge out of this bloodbath as they did in 2008…


6 Comments
Jon why do you never mention what is really behind the market? Are you really unaware or just one of those people that have the ostrich syndrome but choose to be ok with that? The global Economy as you put it hasn’t just all of a sudden changed! It was the same 3 years ago, 2 years ago, as it is today. Why don’t you talk about who really is behind the market and why it does what it does. Don’t pretend that it is a Independent free moving entity based off external factors and functions. How much gold do the Rothchilds own?? How about the Vatican?? How about we talk about how coincidental it is that Cyprus is selling gold to bail itself out just as it crashes, all the while the Rothchilds are sneaking in the back door looking to buy Liverpool.
Yes, sell gold to rothschilds at low cost to finance bailout of high cost, once countries deplete gold supplies they bump the gold value up again. Just at a convenient time when the rothschilds are in the middle of buying up the city of liverpool.
Probably happening like that yes, they may do it to a few more places first, but mostly it was done aparently because cartels hide money in cyprus too!….their cartels, so they grab their money and then the gold gets bought up in the disguise of a bailout with the very money they took.
Works everytime! Give people something of no value, make them believe it has value, steal what they now value, loan them more of the stuff of no value so as they’ll hand over what is of true value.
Bush thug Carl rove came out on record and summed it up nicely
The aide said that guys like me were “in what we call the reality-based community,” which he defined as people who “believe that solutions emerge from your judicious study of discernible reality.” … “That’s not the way the world really works anymore,” he continued. “We’re an empire now, and when we act, we create our own reality. And while you’re studying that reality—judiciously, as you will—we’ll act again, creating other new realities, which you can study too, and that’s how things will sort out. We’re history’s actors…and you, all of you, will be left to just study what we do.”[2]
Bruce Springsteen – I’m going down… watch at youtube…
Hi Heath.
Good quote from Rove!
SO, WHATS NEXT…1332 NOW…RIGHT BETWEEN THE 1320-1350 RANGE…..THIS IS RIDICULOUS WITH THE VENTURE DOWN OVER 7-8% TODAY TOO……HOW MUCH MORE JON?
I have not been on this board for weeks. but I told ya in Feb. that the market will see 2008 lows by summer.
John, according to your chart on silver, we may know tomorrow and not june.
Heath, in this case I have to agree with you 100%. The inexplicable and illogical moves in the market can only lead me to the same conclusion. It is most certainly manipulation. Who is behind it could be anyone (including the Rothchilds). Anyone who thinks this is a “Free Market” is fooling themselves. Case in point, how do you explain gold going from $1,750 to just over $1,300 in approximately 1 year? During this time, the U.S. has continued to print money like it is going out of style and Europe is having serious economic problems. IF this were a true “Free Market Economy”, the two things I just mentioned would be MAJOR catalyts for the price of gold and would propel the price to a range of $2,000 – $3,000 (or more). All we can do is try and “play the game” and hope for good results.