Gold has traded between $1,247 and $1,256 so far today…as of 7:30 am Pacific, bullion is up $1 an ounce at $1,253…Silver is 18 cents higher at $20.58…Copper is flat at $3.32…Crude Oil is up 76 cents at $92.56 while the U.S. Dollar Index is relatively unchanged at 80.56…
 According to ETF Securities, “Gold may be carving out a double bottom near the $1,200 level, supported by strong physical demand, notably from Asia. Indicative of strong physical demand, Gold 1-month forward rates remain negative. At the end of 2013 when the December futures contract expired, the Gold futures curve was in backwardation, another indication of strong physical demand. In contrast to a year ago, after the strong tailwinds coming from the global economic rebound in 2013, analyst consensus expectations for 2014 are strongly in favor of continued depreciation in Gold prices and appreciation in equity prices. The bearish Gold story is well known: increasing bond yields, coupled with a stronger U.S. dollar as the Fed tapers its stimulus activities because of fading tail risks, is keeping investment demand for Gold muted. Increasingly compelling though is the contrarian stance on the back of fundamentally attractive precious metals prices, which ended 2013 below most all-in-cost of production estimates, about $1,200 U.S. for Gold.”
ETF’s view corresponds with the chart John posted here yesterday, but we caution that Gold has two very important hurdles it must cross in order for the “double bottom” theory to begin to play out – bullion must be able to pierce through stiff resistance around $1,275, and then also overcome a downsloping wedge currently positioned around $1,300…
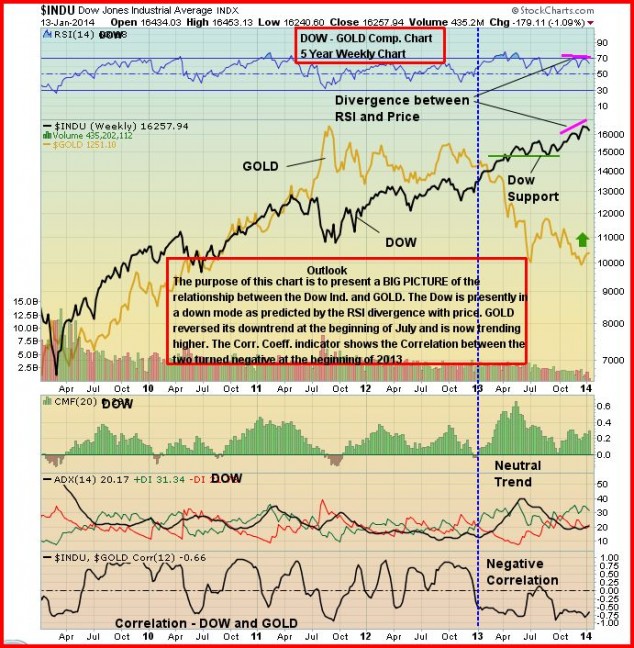
As Kitco contributing analyst Jim Wyckoff wrote yesterday, “If the air continues to come out of the overly inflated stock market balloon, then Gold and other hard assets will continue to benefit”. He may very well be right, and John will examine the current Dow chart this morning after the DJIA suffered its worst session since September 20 yesterday…
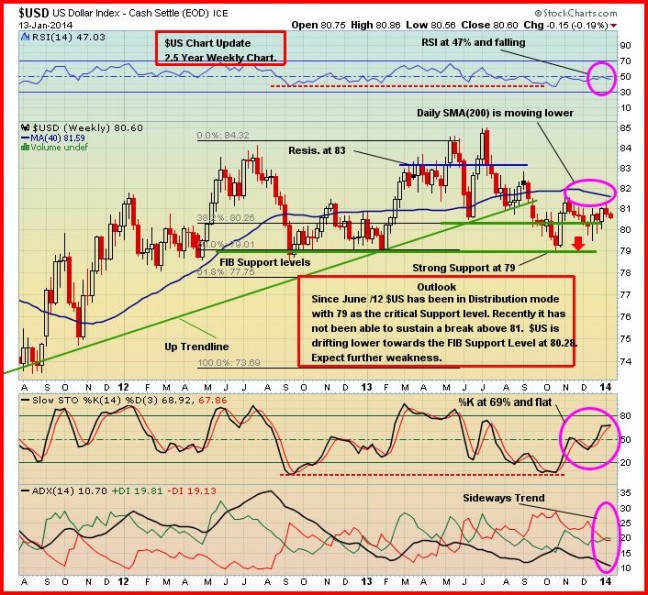
First, an update on the U.S. Dollar Index…one of our readers posted in our comments section over the weekend what is really a consensus view among analysts, that the greenback is in an uptrend…the Venture and the U.S. Dollar Index typically move in opposite directions of their main trends, so his comment was, how could the Venture be ready to breakout to the upside with the greenback in an uptrend?…excellent question, but we disagree with the premise…
We’ve already noted that in October, the Venture broke above a downtrend line on the weekly chart in place since 2011…this was the first important sign that the Index was preparing for a turnaround…interestingly, it occurred just a few weeks after the U.S. Dollar Index did the opposite – it broke below a 2+ year uptrend on the weekly chart after topping out around 85 at the same time early last summer as the Venture bottomed at 859 and Gold touched $1,179…
Since breaching a 2+ year uptrend on the weekly chart, the U.S. Dollar Index has seen its 200-day moving average (SMA) reverse to the downside and a very stiff resistance band has emerged between 81 and 82…critical support is at 79 which, we believe, will be tested sooner rather than later…the implications of a confirmed break below 79 are rather profound…Fib. support levels for the Dollar Index are 80.26, 79.01 and 77.75…this is not a healthy-looking chart, unlike the Venture which has some momentum behind it right now and just needs to overcome resistance in the 970’s…
The U.S. Dollar sell-off, as you can see in the above chart, had its genesis before Friday’s news that the American economy created just 74,000 jobs last month versus expectations for a 200,000 gain…it’s also interesting to note that China’s yuan has hit a record high vs. the dollar for a second straight day at 6.0415…
“Certainly, it [the dollar move] is a very grave challenge for the dollar bulls,” Sean Callow, senior currency strategist at Westpac Bank in Sydney, told CNBC yesterday…“It’s a definite worry if you’re bullish on the dollar because there’s been no shortage of economists coming out to explain that the December payrolls report was impacted by special factors and could be reversed next month,” Callow said. “They could be right, yet the money is not being placed to back that call.”
Updated Dow Chart
Below is a 5-year weekly chart on the Dow with a Gold comparison as well…the main “takeaway” from this chart is the recent Dow divergence between RSI(14) and price, coupled with declining buy pressure…that’s typically a warning sign of a possible correction…the divergence does not indicate when the reversal will happen or how deep it might be, just a high probability that it will occur…since the correlation with Gold is negative, one can expect bullion to move higher as per John’s chart and Wyckoff’s comments…
Updated CRB Chart
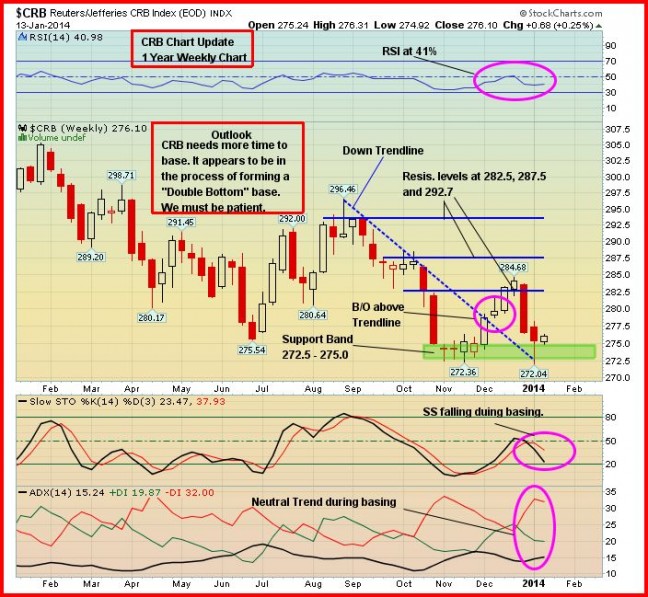
There are some signs of encouragement in the CRB Index…in December, it broke above a downtrend line in place for a few months on the weekly chart…that downtrend line has become fresh support…the behavior of the Venture seems to suggest that the CRB is indeed forming a double bottom base…we’ll have to wait and see…weakness in the U.S. Dollar would certainly give the CRB a lift…
Today’s Markets
Asia
Asian markets were mostly lower overnight, though China’s Shanghai Composite bucked the trend with a gain of 17 points to close at 2027…Japan’s benchmark Nikkei average plummeted nearly 500 points or 3.07% due to a sharp uptick in the yen following Monday’s holiday in that country…
Europe
European shares are slightly lower in late trading overseas…industrial production for November was up by 1.8% in the euro area compared to the month before, according to Eurostat…production saw a gain of 3% compared to November 2012…
North America
The Dow will try to reverse a 4-session slide today…it’s up 42 points through the first hour of trading after yesterday’s plunge……a gauge of U.S. consumer spending rose more than expected in December, suggesting the economy gathered steam at the end of last year and was poised for potentially stronger growth in 2014…the Commerce Department said this morning that retail sales excluding automobiles, gasoline, building materials and food services, increased 0.7% last month after a 0.2% rise in November…
About two dozen S&P 500 companies will report earnings this week…overall, analysts expect 4th quarter earnings for the S&P 500 to rise about 7%…
The TSX has climbed 57 points to 13739 as of 7:30 am Pacific…meanwhile, “13” proved to be an unlucky number for the Venture yesterday as its longest daily winning streak in many years was finally snapped…it’s up a point to 966 in early trading…
TSX Gold Index Updated Chart
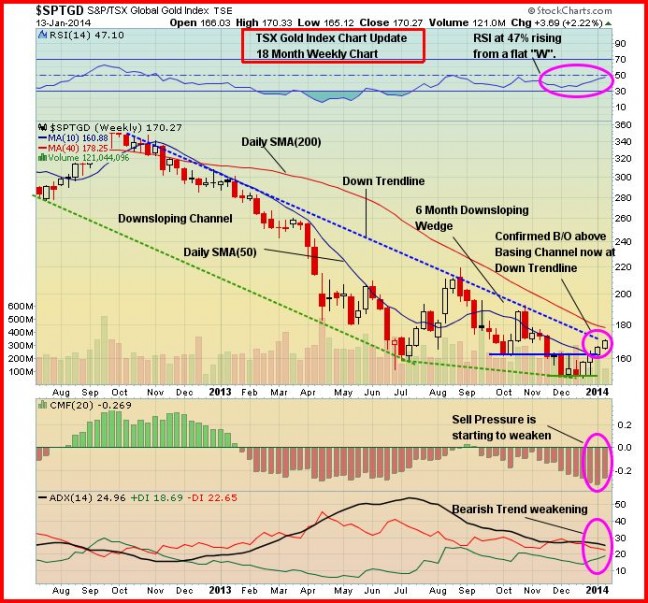
Critical point for the TSX Gold Index…it has pushed above a 3-month basing channel and is now up against a long-term downtrend line with its declining 200-day moving average (SMA) not far above that…the Index is up 2 points at 172 as of 7:30 am Pacific…
Reservoir Minerals Inc. (RMC, TSX-V)
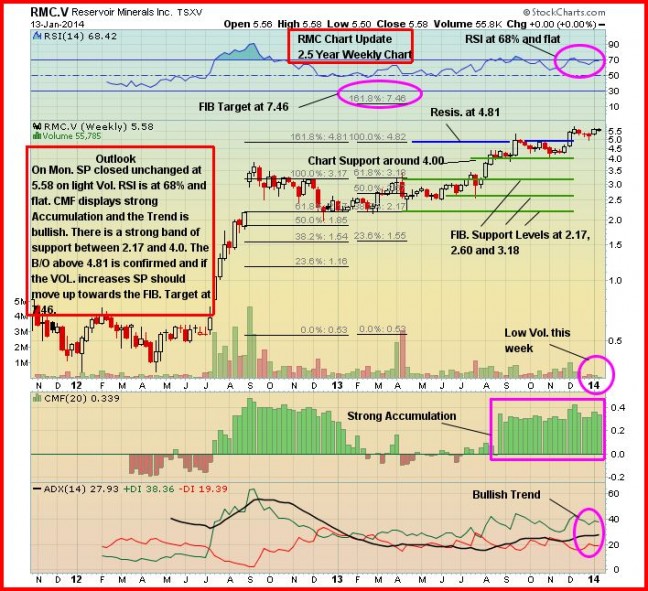
Reservoir Minerals (RMC, TSX-V) in our view is one of the top discovery plays on the Venture with its large land package in Serbia, including an important JV there with Freeport McMorRan…a recent drill result from a known high-grade zone at the Cukaru Peki target (part of the Freeport JV) returned a 166-metre interval grading a spectacular 7.75 g/t Au and 6.65% Cu (11.29% CuEq)…Gold can do whatever it wants – a discovery play like this will march to its own drumbeat, and the potential upside – even with the current share price in the mid-$5.50’s – is even greater if Gold turns the corner this year and the Venture performs the way we believe it will…
Below is a 2.5-year weekly RMC chart from John…an important breakout occurred last month when RMC decisively pierced the $5 level…
Magor Corp. (MCC, TSX-V) Updated Chart
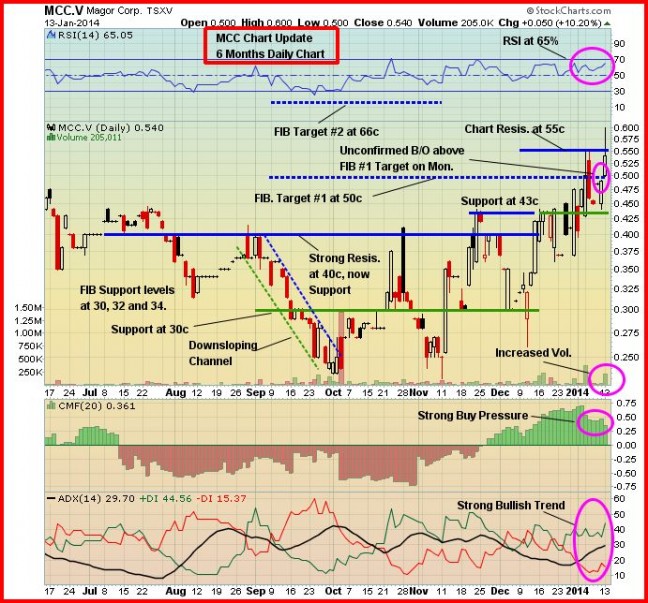
While we’re focused mostly on the resource sector at BMR, when a legitimate tech play comes along that has highly respected people behind it, we don’t ignore it…that’s certainly the case with Magor Corp. (MCC, TSX-V), a video collaboration company, which is finally beginning to gain traction both in the market and with its business model…as always, perform your own due diligence, but we have been impressed with this company and its possibilities ever since it started trading on the Venture last March…the share price has rocketed from a low of 26 cents last month to an intra-day high yesterday of 60 cents…it closed yesterday at 54 cents, a breakout above Fib. resistance that requires confirmation today…there is also chart resistance at 55 cents…
Note: Jon holds a share position in MCC.

4 Comments
Picked up some ggi at 11 cents today
2014 stock picks
graphite2 up 34.18 stocking stuffer5 up 4.91 bmr20 up 3.27 percent
What are those lists again Gil?
Justin the 20 venture plays were listed dec 24 stocking stuffers on dec 20 the two graphite picks were mine on dec 20