Gold is strengthening after dipping as low as $1,330 overnight…as of 8:15 am Pacific, bullion is up $9 an ounce at $1,346…we have two important Gold charts this morning – see below…Silver is 18 cents higher at $21.34…Copper is flat at $3.21…Crude Oil is 19 cents lower at $101.26 while the U.S. Dollar Index is under pressure again, off more than one-third of a point to 79.72…
 Check out Mineweb (www.mineweb.com) for some interesting comments from Eric Sprott regarding Gold in a Podcast interview with Geoff Candy (Podcast Gold Weekly – The Effects of Gold Market Manipulation and the Opportunities for Equities): Sprott stated, “I wrote an article called “Don’t miss this Golden opportunity” which is available on Sprott.com and basically it hypothesized that the price of Gold was manipulated in the last two years, that we had this linear trend of where was Gold was going, that we got off that trend and of course the trend started in 2000 and was right on trend until 2011. Then all of a sudden it came off that trend. Our argument is that when it goes back to trend, it should be at $2,100 today and it would be something like $2,400 at the end of the year. I strongly believe that’s the case, I strongly believe the western central banks have very little Gold left (our emphasis) and I suspect it’s probably going to overshoot that trend line when all is revealed that western central banks don’t have as much Gold, if any, and people say well how can you say they may have no Gold? I say, well, the U.S. owns theoretically over 8,000 tons of Gold, Germany asked for their Gold back and they deliver five tons. Well how can you only deliver five tons when you’ve got 8,000 tons? And it’s not logistics because China imports 100 tons a month.
“This is not a logistical issue,” Sprott continued…“You can look at all the data. It’s quite relevant, it’s there and I think western central banks who don’t have to declare that they’re selling Gold because they have a line in their balance sheet called Gold and Gold receivables. One line and how much is physical and how much has been leased which was very convenient on their part, and I think they’ve been leasing it out for the last 14 years (our emphasis) and demand has always exceeded supply for that time. When I wrote the article “Do the western central banks have any Gold left”, in late 2012 it seemed obvious. We knew how much Gold they had and now it’s 12 years later, and they probably don’t have any left. Was I surprised to see the raid on Gold and the dumping of the ETFs at 1,300 tons come up? No I was not because that was the problem, they didn’t have Gold. And I believe it to this day. We’re all going to find out that they don’t have the Gold, that they’ve got a currency that’s valueless, that most of the countries are broke. That’s the easiest call in the world to make, that most countries are broke. Look at the obligations they have and look at the income they have and there’s just no way they’re going to meet their obligations, which means their currencies are going to be coming under pressure. What’s the alternative to currencies? The alternative is to own something real and for the most part the intention goes to Gold.”
Gold – The “Big Picture” 20-Year Chart
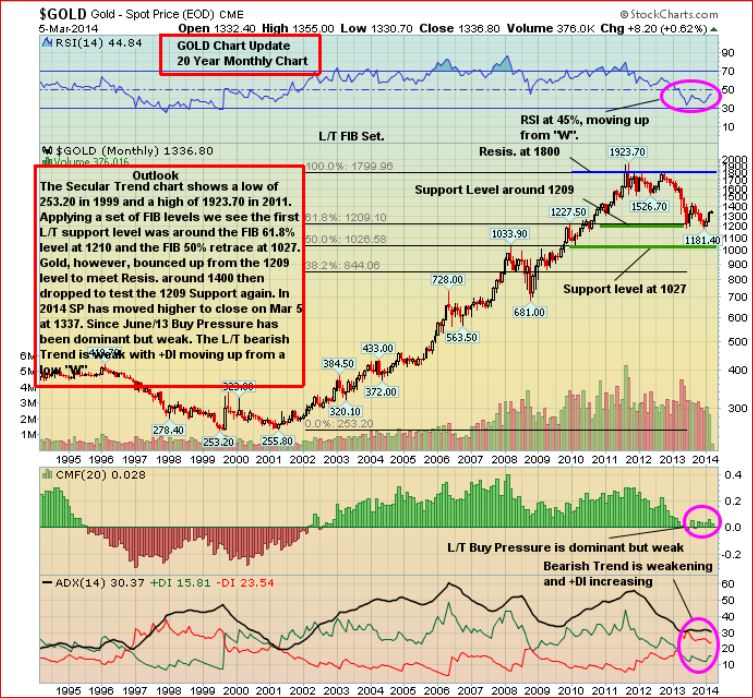
We have two important Gold charts this morning…the first is a 20-year chart going back to 1995 that of course shows the 1999 low of $253.20 and the September 2011 all-time high of $1923.70…a few things are interesting about this chart:
1. RSI(14) has formed a bullish “W” pattern and is now at 45% and moving up; there was a slight divergence between RSI(14) and price at the end of 2013 – bullish…
2. Gold found strong support around the Fib. 61.8% retracement level; the 50% retracement is $1,027 but a drop to that level seems highly unlikely given the breakout in the Venture and many Gold stocks, and the fact that Gold ETF selling peaked last year which has moved a lot of supply off the market in 2014…
3. The bearish trend that started in late 2011 clearly peaked last year as shown by the ADX(14) indicator; +DI is on the increase and a bullish potential +DI/-DI crossover could certainly occur at some point this year…
Gold 2-Year Weekly Chart
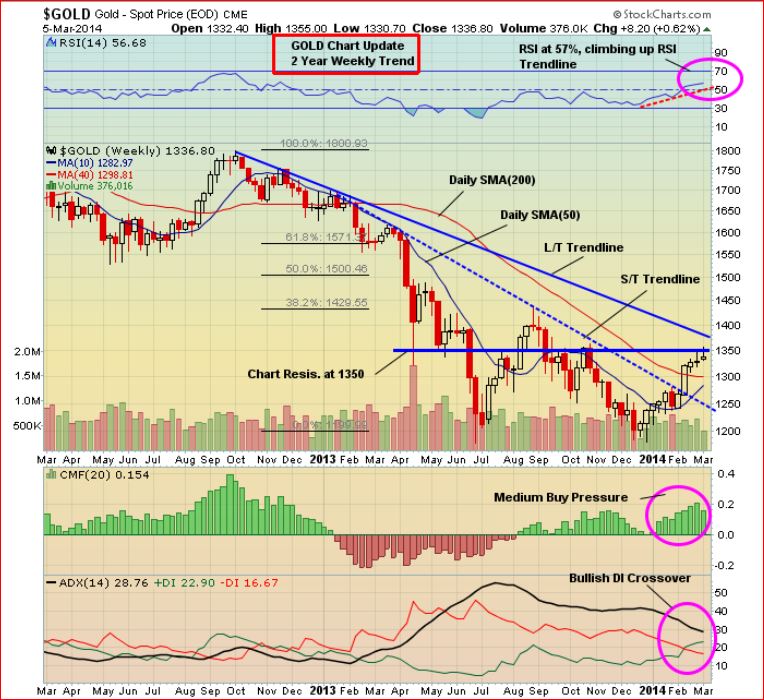
This 2-year weekly chart tells us the following:
1. Gold broke above a short-term downtrend line in February and has been attempting, without success so far, to push through stiff resistance around $1,350…
2. RSI(14) at 57% has plenty of room to move higher and is climbing an uptrend line…
3. A bullish +DI/-DI crossover occurred in February – this has a better chance of staying intact now than it did in 2012 unless major new sources of selling come into the market…
4. Gold is within shouting distance of pushing through a downtrend line in place (now around $1,375) since the $1,800 recovery high in 2012…this is why overcoming resistance at $1,350 is so critical…
Our view is we will see Gold break above $1,400 in the not-too-distance future…however, a shorter-term chart (9-month daily) shows RSI(14) levels in overbought territory and a slight divergence between RSI(14) and price, so one cannot rule out the possibility of some consolidation below $1,350 and a test of support around $1,300 before bullion surges higher again…tough call in terms of what immediately lies ahead – the next several trading sessions should prove interesting…physical demand needs to show strength at $1,350 and higher…
Putin’s Expensive Adventure
The Bank of Russia sold a record of $11.3 billion in foreign currencies to help stabilize the ruble after markets panicked Monday in the wake of Russia sending troops to the Crimea region of Ukraine…the central bank released the costs of its intervention on a daily FX operations report…the bank did not release any further information…along with the currency intervention, the central bank also had to hike rates 150 basis points to 7% on Monday to stop the dramatic slide in the currency…on Monday during the height of the Ukrainian-Russian conflict, the U.S. dollar hit an all-time high of 36.614 against the ruble…
Today’s Markets
Asia
China’s Shanghai Composite shook off concerns over the country’s first-ever domestic bond default, and climbed 6 points to finish at 2060…solar equipment producer Chaori Solar said it will not be able to meet interest payments on bonds due tomorrow…Japan’s Nikkei surged 237 points overnight or 1.6%…
Europe
European shares are up slightly in late trading overseas…as expected, the ECB left its main interest rate and its deposit rate unchanged at 0.25% and 0%, respectively…ECB President Mario Draghi gave a news conference following the decision, stating that the modest recovery in the euro zone was continuing…he firmly reiterated forward guidance…the Bank of England also kept interest rates at record lows today…
North America
The Dow is up 74 points as of 8:15 am Pacific…the number of Americans filing new claims for unemployment benefits fell more than expected and hit a three-month low last week, a sign of strength in a labor market that has been hobbled by severe weather…separately, the U.S. government sharply revised down non-farm productivity for the fourth quarter, mirroring the economy’s slow growth pace in the same period…
According to news organizations, estimates for new-job creation in tomorrow’s non-farm payrolls report for February hover between 143,000 to 150,000…113,000 jobs were created in January…the stock market is likely to win either way tomorrow…if the jobs number is weaker than expected, markets will shake it off and blame it on bad weather…on the flip side, investors may find reasons for encouragement from a better-than-expected jobs number…
TSX Updated Chart
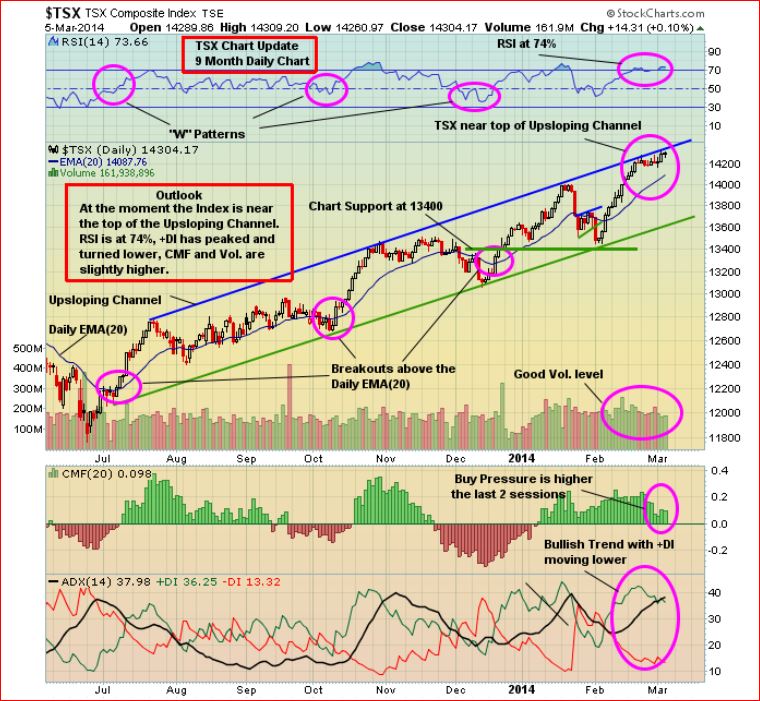
The TSX continues to hug the top of an upsloping channel with RSI(14) in overbought territory at 74%…could we see a breakout – even a “false” breakout – above the channel in the near future?…absolutely, but that would likely create very overbought conditions which would be followed by a healthy pullback…a minor correction from current levels is also possible based on this chart…as of 8:15 am Pacific, the TSX is down 17 points…
The Venture continues to rock ‘n roll…it’s up another 9 points at 1038 as of 8:15 am Pacific…next major resistance, as John’s charts have pointed out, is the 1150 area…
Alix Resources Corp. (AIX, TSX-V) – The Sheslay Valley’s Undiscovered 3.5-Cent Opportunity
A company worthy of our readers’ due diligence which has gone through some important changes recently and is interestingly 100% focused on the Sheslay Valley is Alix Resources Corp. (AIX, TSX-V)…they have been steadily building a strategic land position in this rapidly emerging area, and their most recent coup was securing a very reasonable deal with privately-held Divitiae Resources to acquire a claim package that covers the entire northern border of Prosper Gold Corp.’s (PGX, TSX-V) Sheslay Property (mineralization trends north, open in all directions in fact) and much of the northwestern border of Garibaldi Resources Corp.’s (GGI, TSX-V) Grizzly Property…as the masses become more aware of the discoveries and the potential of the Sheslay Valley, and all three major players (PGX, GGI and Doubleview Capital Corp. – DBV, TSX-V) commence drill programs, Alix will be in an ideal position to gain serious attention and traction in the market…so rather than chasing AIX at potentially much higher levels, now in our view is “accumulation time” with the stock strongly supported by a rising 50-day moving average (SMA) and a 200-day SMA that has flattened out at 3 cents…interestingly, AIX is pursuing not just Cu-Au porphyry opportunities in the Sheslay Valley, but sees the potential for epithermal Gold deposits as well…in addition to its “North Cap” holdings, immediately above Prosper and Garibaldi, Alix controls nearly 50 sq. km on strike southeast of the Grizzly and east of Teck Resources Ltd.’s (TCK.B, TSX) Eagle Project…AIX is quickly becoming a serious player in this area, and our due diligence shows they have a highly capable geological team that’s not interested in playing “closeology” – they are going to push hard with a game plan to drill and make discoveries of their own…the chances of more discoveries on the Sheslay, the Grizzly and the Hat are high, not to mention elsewhere…AIX has become extremely well positioned to take full advantage of that and is actively preparing a game plan for tackling priority areas along the Prosper and Garibaldi northern borders and in the south where there are interesting Minfile showings (Halt and Vi) that are worthy of serious investigation…
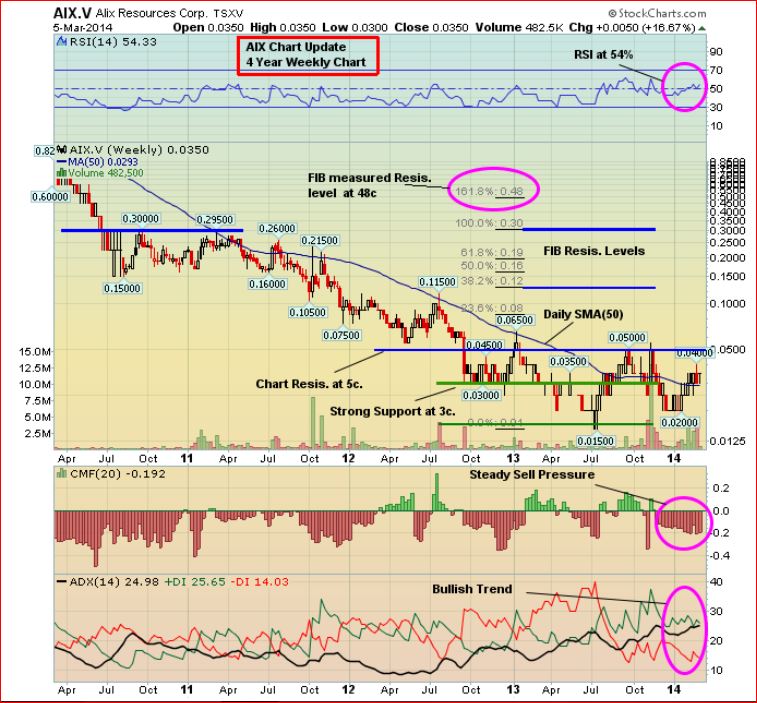
Below is a 4-year weekly AIX chart from John…the RSI(14) and ADX(14) indicators point to a well-defined bullish trend with the 5-cent level as key resistance…AIX is unchanged at 3.5 cents as of 8:15 am Pacific on total volume (all exchanges) of more than 700,000 shares…it has liquidity…as always, perform your own due diligence…
Coming Soon: Part 2 of our Special Feature on DBV: “Hang On To Your Hat”. Doubleview is looking strong this morning and we’ll be providing a short update tomorrow in advance of the second part of our feature on the Hat discovery.
Eskay Creek Mining Corp. (ESK, TSX-V) Update
We introduced this “sleeper” for our readers’ due diligence February 18, and since then Eskay Creek Mining (ESK, TSX-V) has climbed more than 50%…it’s a certainty that northwest British Columbia is going to be a hot exploration area this year, all the way up to the Sheslay Valley and beyond…ESK controls 40 sq. km surrounding the prolific past producing Eskay Creek mine, and they have some giant neighbors – Pretium Resources Inc. (PVG, TSX) and Seabridge Gold Inc. (SEA, TSX)….while it was in operation, Eskay Creek was the second richest deposit in North America and the fifth largest Silver producer in the world…a technical adviser for ESK is the highly respected James Rogers, P.Geo., who was Chief Geologist at the Eskay Creek mine between 1994 and 2003…Rogers prepared an ESK corporate presentation which is available on their web site – we suggest our readers check it out…
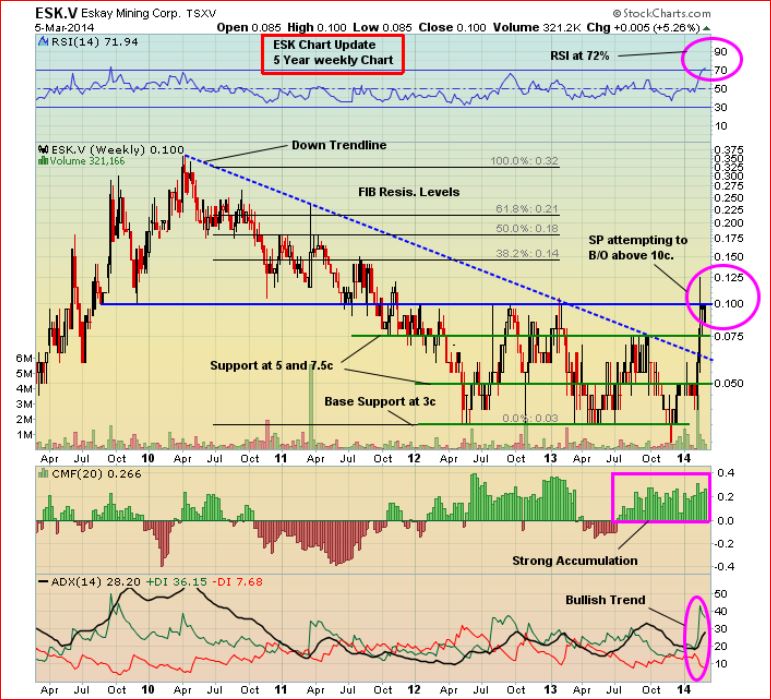
Technically, ESK has successfully broken out above a long-term downtrend line after finding rock-solid support at 3 cents…in recent weeks there has been a volume surge in the stock which is what initially caught our attention…below is an updated 5-year weekly chart from John…the stock is attempting to overcome important resistance at 10 cents…
Mason Graphite Inc. (LLG, TSX-V) Updated Chart
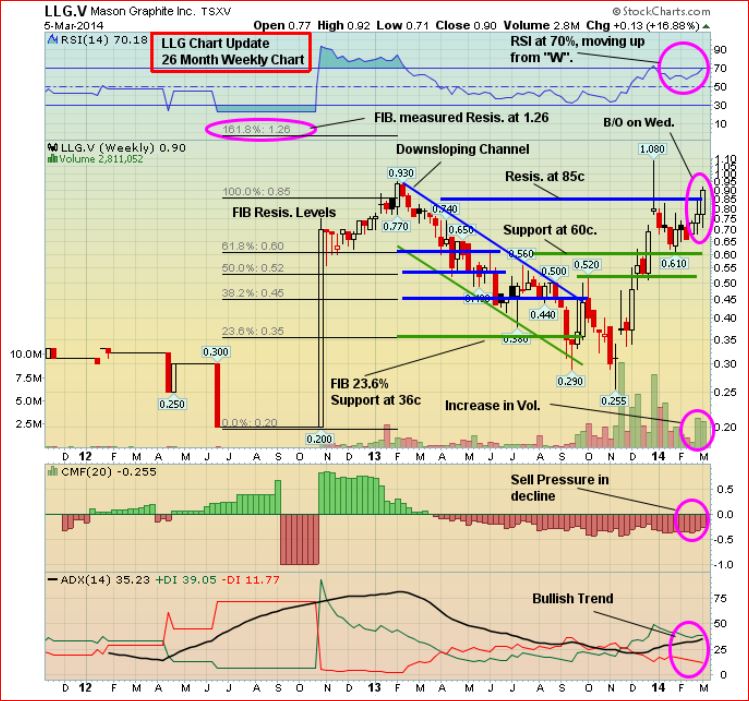
The ever-volatile Mason Graphite (LLG, TSX-V) continues its roller coaster ride…the 50-day SMA provided excellent support on the retracement from the late December high of $1.08 to the late January low just above 60 cents…there has now been a breakout above resistance at 85 cents as you can see in this 2+ year weekly chart…
Note: John and Jon both hold share positions in GGI, AIX and DBV. Jon also holds a share position in PGX.

15 Comments
The US$ is not looking too good. It couldn’t hold that psychological level of 80. Several pundits have been calling for a dollars crisis to happen in 2014. I wonder if this is the beginning of the move downward? It generally bodes well for commodities, but expect to feel a lot of pain while shopping (just look at coffee’s chart!).
John.S I just keep thinking of your comment that you wrote a few days ago because I totally understand you when you get concerned that you won’t sell in time and lose money. I too am new to investing in stocks and have lost money not selling soon enough and knowing when to cut my losses and move on. I feel the hardest part in investing is knowing WHEN to sell. Reading the information from Jon/John has helped but it would sure be nice to receive alerts/advice as well from the more experienced investors when things aren’t looking good. One tip I learned from a friend is that when there is a lot of volume around the time drill results should be out and the price isn’t going up that should be a red flag. Again I’m just new so take this with a grain of salt or please correct me if this info is wrong. I too have GGI and am hoping for the best! I’ve learnt so much and appreciate all the help the people on this site give and am open to lots more advice to be a better trader.
Rebecca- the easy part is buying… the hard part is selling. The greed factor!!
So true Greg! And unfortunately I’ve had to learn the hard way and still trying to control my greed.
The best way to protect yourself is to do your due diligence and only listening to Jon on BMR is not it, (no offense Jon), but you need to call the company and talk to the person/s in charge, I stay away from the pr guy as they are paid to promote, I speak to the geologist, the CEO and ask questions. I check on sedi and sedar about the company, how many shares outsanding and are held by insiders, we’re they involved in the last pp or not, how much selling have they done, are pp shares that were on hold from the lasp pp coming free trading at the same time as the results ( could stop any momentum) what other companies or projects have management been involved in and were they successful. Find a conatct that can interpret results. These are a few things I do but the one major rule I have is never invest more than you can afford to lose if things go sideways as the venture is high risk high reward. As far as trying to understand volume, yes sometimes volume is a good indicator prior to the release of results but that’s usually an indicator that news has leaked but it’s not always accurate. And the final statement is , you can never blame some else for your mistakes regardless of what and how they promoted the project, that responsibility lies with you. Ive been investing for a while and had made and lost money so please don’t take what a said as gospel it’s just my two cents.
Took a position in ABR and AIX today, after reviewing past nr of Ashburton, they seems to be area players. They never had drills results in their nr release. Jon are you confident they will get serious in advancing their properties to drilling this summer(Yukon and sheslay), what is ABR cash position Thanks!
Hi Martin, yes, I fully expect ABR to drill – their cash position is low at the moment, but that doesn’t concern me in this case as they can finance internally thru the exercise of warrants at 10 cents (about $1.2 million). Note the accelerator clause attached to some of the warrants in the news the other day. My thinking here is that ABR could really take off near-term just based on developments at the Sheslay – more DBV drilling as the discovery holes are just 1,000 m west of ABR’s Hackett Property. The trend is southeast toward the Hackett and historical reports (Minfile occurences) confirm that mineralization moves east toward the Hackett. The Hoey showing almost straddles the border. With a $2 million market cap this is a no-brainer IMHO, hence they should be able to raise money internally (just like DBV is doing) and then perhaps be in a position to pull off a sizable financing at significantly higher prices by summer, if not before. Volume has picked up nicely in ABR since the end of January and I think that’s just the beginning. Can you imagine where ABR could go if DBV hits again and ABR then goes ahead and drills the Hackett? That would be dynamite. Plus they have platinum in the Yukon, and they’re contiguous to the Wellgreen deposit.
Any comments on PKL would be appreciated. Noticed a steady rise from 2 cents to 8 cents in just a few weeks.
Collect RBW at 2.5 cents again! Nothing to lose.
That is what i am betting on! Also like their PGM land position!
Paul- your ” two cents” is great advice.
Looks like DBV consolidation is done. Farshad(CEO) is said to be done selling his 1.5 milion shares that he needed to sell to pay for the exercise of his warrants which in turn pays for the drilling! The stock price has held up very well unlike the other area plays so this tells me what the market thinks about it. Looks like it will retest the high of .30 and my bet is that it breaks it. Farshad is about to go up to the site to start drilling so they will be the first ones drilling and the first ones with results. Slide 14 of the powerpoint presentation shows that DBV plans to drill 21 holes so they will have one of the biggest drill campaigns in the region! Farshad smells what he has under the ground and he is not wasting any time in uncovering it to prove to the market what he has believed all this time! Once one of the other area plays demonstrates that they too have the goods I will get into them but for now they just own land. I am monitoring all other plays.
Look forward to the DBV part 2.
d4, you’re absolutely correct that Farshad has done an admirable job in tackling the Hat and this next round of drilling is going to be exciting. The slide in the PP presentation that interests me most, however, is slide 13 and we’ll get into that in the coming days. On another note, with regard to your comments, as impressed as we all are with how Farshad has moved the Hat along, the most advanced project in the Sheslay Valley remains Prosper’s Sheslay Project, and 29 holes at the Star have demonstrated they have the goods there, and extensive geochemical and geophysics work points to a widespread system with excellent potential for at least 2 major deposits – the Star, North Star and East Star areas, and Pyrrhotite Creek 4 km to the southwest. On the Grizzly, all the signatures are the same as what’s being seen at the Sheslay and the Hat. The Grizzly has massive scale to it – the biggest of the three – but just hasn’t been drilled yet. That of course is about to change. Other properties in the district can certainly be referred to at this point as “area plays”. Who ultimately will have the biggest or richest deposit – Prosper, Doubleview or Garibaldi —– that remains to be seen. And of course potential deposits on ground not currently held by those three is very possible, too.
AIX picked up more ground in the area again! I think it’s the 2nd largest now?!
Steven, looks like AIX has staked contiguous to (immediately above) one parcel of ground they acquired from Divitiae attached to the northwestern border of the Grizzly – North Cap West as they’re now calling it…their North Cap East claims cover the entire northern border of the Sheslay (8 km) and the NW tip of the Hat Property…IMHO, AIX is an absolute steal at 3-4 cents as the overall Sheslay Valley play gets set to heat up…this reminds me of Mike England’s move into the Blackwater area during Richfield’s discovery (Pete Bernier again) with Geo Minerals and that company ultimately got taken out by New Gold for $23 million with a spin-out to boot…