Gold remains firm to begin a new week after a powerful move last week…as of 7:35 am Pacific, the yellow metal is up $4 an ounce at $1,735…Silver is down 3 pennies to $32.60…Copper is off slightly at $3.44…Crude Oil is flat at $86.03 while the U.S. Dollar Index is unchanged at 81.00…
Updated Silver Charts
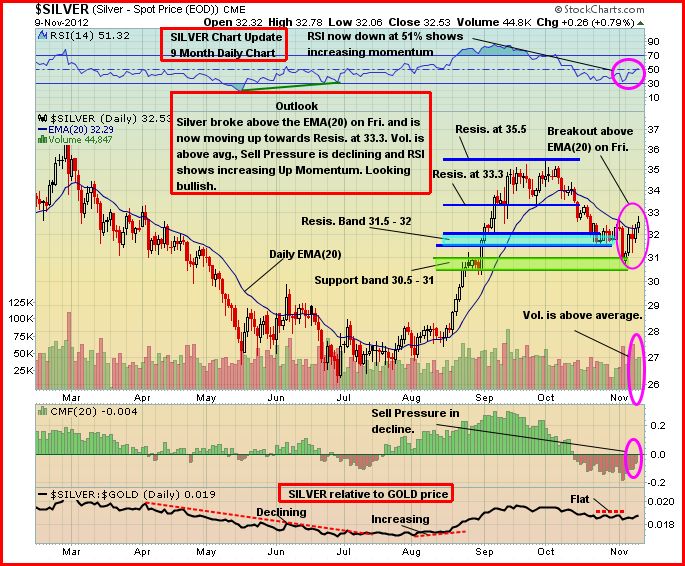
As usual, we have updated short-term and long-term Silver charts this morning and both pictures looks very good…on the 9-month daily chart, the important support band between $30 and $30.5 held while on Friday Silver pushed through its EMA-20 which is now reversing to the upside…the next two major areas of resistance are $33.30 and the recent high of $35.50…
Short-Term Silver
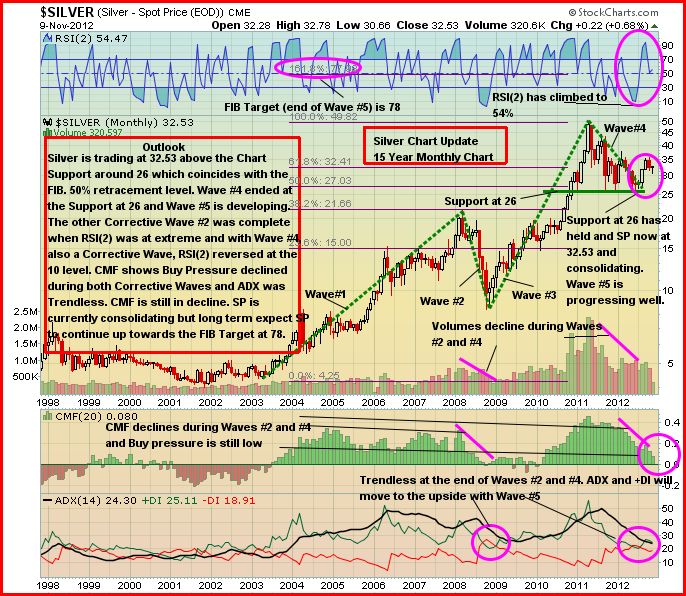
Long-Term Silver
A recent overbought condition in the RSI(2) indicator has cleansed itself, and we do expect the RSI(2) in this long-term chart to climb back into overbought territory in the near future which would be consistent with previous patterns…Wave 5, with a Fibonacci target of $78, continues to progress in a very orderly fashion…
Today’s Markets
Trading is quieter in North America today due to the Remembrance Day holiday in Canada and Veterans Day in the United States…as of 7:35 am Pacific, the Dow is up slightly to 12822…7 of the last 23 sessions have featured triple digit losses, bringing the Dow very close to its rising 300-day moving average (SMA) where there should be excellent technical support as was the case last spring…the Venture Exchange is up 5 points to 1306…Asian markets were mixed overnight while European shares are also mixed toward the end of the trading session there…
Japan Weakens, China Strengthens
Japan’s economy shrank 0.9% in the three months to September, marking the first contraction in three quarters and adding to signs that slowing global growth is nudging the world’s third-largest economy into recession…meanwhile, data on Saturday showed China’s trade surplus ballooned to its biggest in 45 months in October as export growth jumped to a five-month high above 11% – more evidence of an improving Chinese economy…
U.S. Dollar Index Chart Update
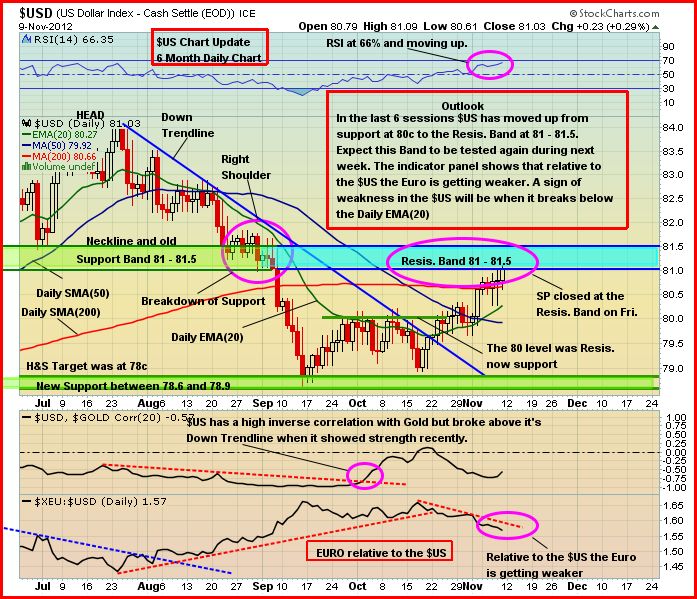
The U.S. Dollar Index has shown some strength recently but its big test will be if it can work its way through a stiff resistance band between 81 and 81.5…the daily EMA-20 (currently 80.27) is providing support…one very negative feature about the Dollar Index is the fact the 50-day SMA is in decline and has crossed below the 200-day SMA (the opposite situation has occurred in Gold, a rising 50-day has crossed above the 200-day)…so we view this rebound by the Dollar Index as very suspect…two things to watch out for – either a convincing break above the top of the resistance band (which would also put the Index in an overbought condition), or a break below the EMA-20…it’s interesting that both Gold and the Dollar Index moved higher last week…the assumption that Gold can only go higher on a weaker U.S. Dollar is not always true…
Venture Exchange
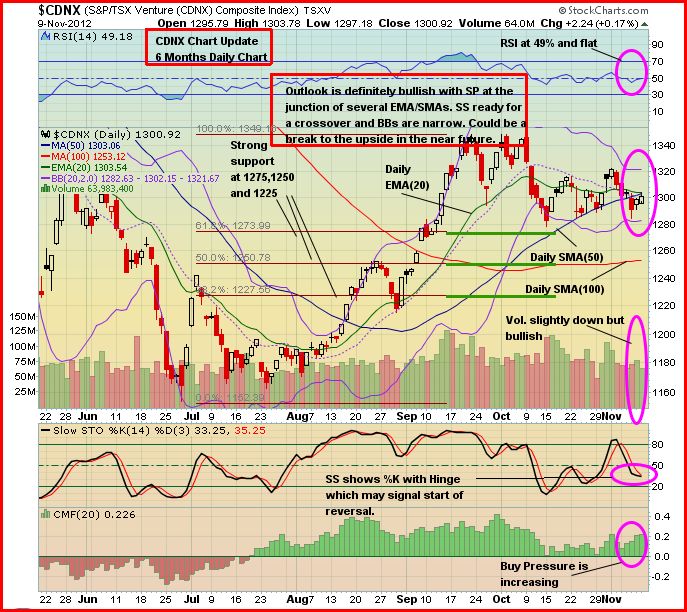
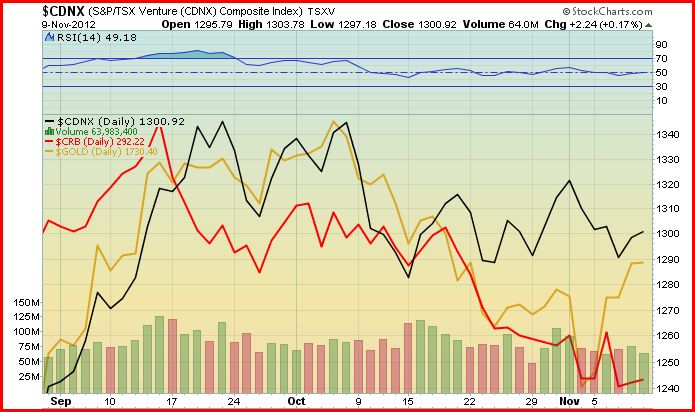
We continue to see plenty of underlying technical strength in the CDNX even though this market has been trading in a very narrow range over the past two months, from a low of 1283 to a high of 1345 on a closing basis…the Slow Stochastics(14) indicator appears to be forming a bullish “hinge” on John’s 6-month daily chart below while buying pressure has recently been increasing…as we showed in a chart yesterday as part of the Week In Review, the Index is also very close to breaking above a down trendline in place since the early part of 2011…so our outlook remains very positive, and it’s our contention this market will really catch fire at the beginning of the first quarter next year…now is an ideal time, therefore, to be performing due diligence on a wide number of potential individual stock opportunities…
It’s always a bullish sign whenever the Venture is outperforming Gold, the CRB Index and the broader equity markets…this has been the case recently and we believe this new trend will continue for at least the several months…below is a comparative chart from John that we posted yesterday but it’s worth posting again because of its significance…notice how September marked a turning point for the CDNX (black line) in relation to Gold and the CRB…
Huldra Silver (HDA, TSX-V)
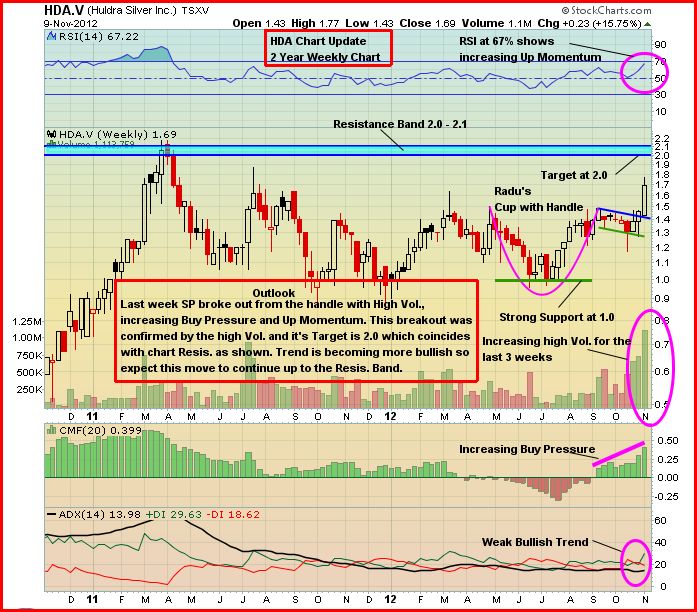
Huldra Silver (HDA, TSX-V) announced this morning that it has been making some minor modifications to the processing plant at its mill in Merritt, B.C., and is now awaiting Ministry approval to re-start operations after a brief shutdown…Huldra says its considers the mill commissioning to be substantially complete…meanwhile, the high-grade Treasure Mountain Mine continues to operate with stockpiles of mill feed increasing on a daily basis from underground operations…this is a production situation we’re extremely bullish about, and the potential for additional discoveries at Treasure Mountain has to be considered high given that drilling has only been carried out over a small portion of the property…below is a 2-year weekly chart from John…notice the recent breakout (strong new support at the breakout point) and the “cup with handle” formation…as of 7:35 am Pacific, HDA is off 6 cents at $1.63…
Gold Bullion Development (GBB, TSX-V)
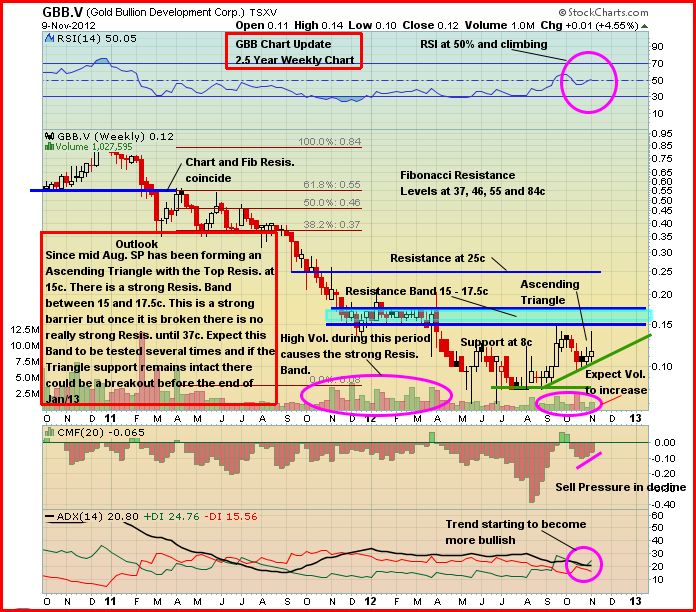
Last week’s drill results from Gold Bullion (GBB, TSX-V) weren’t spectacular but certainly strong enough to continue to support the case that the upcoming NI-43-101 updated resource estimate should show a significant increase in ounces…what gets us more excited about Granada is not the narrow very high-grade intercepts that occasionally pop up, but the distribution of Gold in the vein systems…long widths of lower-grade mineralization are critical and the LONG Bars Zone, it appears, continues to deliver in that regard…technically, GBB is looking better than it has in quite some time as shown in John’s 2.5-year weekly chart below…the stock’s biggest challenge between now and year-end is to work its through a strong resistance band between 15 and 17.5 cents…
Mineral Mountain Resources (MMV, TSX-V)
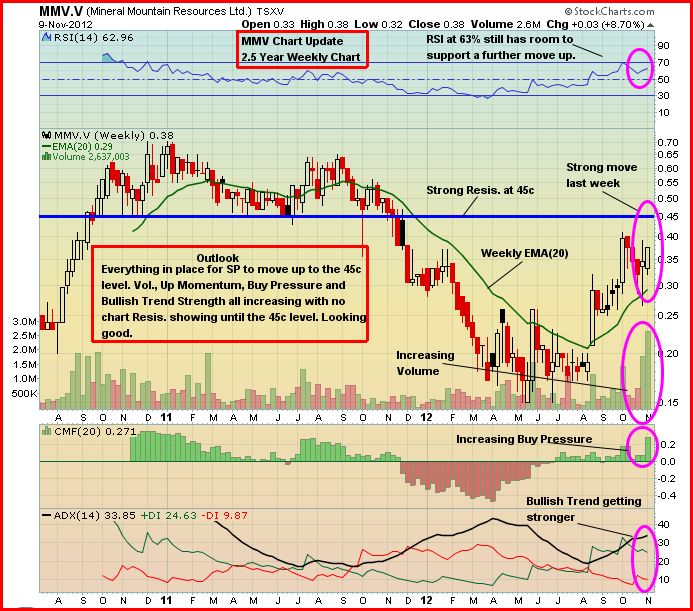
A situation that continues to look very interesting is Mineral Mountain Resources (MMV, TSX-V) which has been drawing a lot of interest recently in some financings as it begins to tackle its Holy Terror Gold Project in South Dakota…we encourage our readers to perform their due diligence on this one…MMV is off 4 pennies at 33.5 cents on light volume in early trading…below is a 2.5-year weekly chart…
Note: Jon holds a share position in HDA while Terry holds a share position in GBB.

14 Comments
Jon. Ya the one hole of gbbs was just average eh!!!! Very disappointed in you Jon but not surprised
Heath, why do u think the stock was unchanged for the day and traded less than a million shares on a result of 29 metres grading 15.61 g/t Au? You know why, because almost all that gold was contained within a 1-metre interval. If the mineralization was consistent throughout the hole, different story. On the one hand it’s interesting that they hit such high-grade over 1-metre, but extrapolating that result over 29 metres to show 15 or 16 g/t Au – the market is very wise to that. So, yes, it’s not a spectacular hole. What will make Granada fly is nice distribution of gold over long widths. Any geologist will tell u that.
OSK offers a buyout for QMI for $6 (based on OSK shr price) a shr today – anyone know QMI’s avg grade, ozs P+P, etc
Thanks for posting the cup and handle formation. Another interesting stock in the process of forming a cup and handle on the 1 year chart is ATN.to. It’s a gold producer with a rapid growth curve. They are bringing the Pinson mine on production and that should more than double production in 2013. Worth looking into.
Heath…. grow up will ya??? those comments are not productive… just like I’m sure you will find this one non-productive!!
Funny u say that Jon!!! Show me what company has moved in the last year on good results. Good luck with that. Rather then say it how it is, thst the venture is dead right now and that mms have obviously been manipulating gbb sp for a year now you chose that road eh!!!and if. Do give examples please don’t use gqc as that is laughable and was just one big orchastrated pump by mms. You know that as well as I do
Also funny u mention market getting wise to certain things. Seems the market has gotten wise to RBw doesn’t it!!
@jeremy. No worries brother. I have very low expectations!! Iv yet to see a productive post from yourself
Heath no need to be bitter – it certainly hurts to see GBB and other juniors trading it such low valuations. We are in the worst bear market ever for the venture and BMR simply can’t admit it. After all, this website is a bull’s website and that is what they will endorse to death. Nothing more nothing less.
All we can realistically do is buy equities we feel will recover and actually bring something to the table. If you think GBB will be a producing mine someday, then go on a buying frenzy today. And you’re right, the market has certainly spoken with regards to RBW – recent price action has been pretty telltale about where it thinks RBW is heading/ I am very worried because I own a position that will pretty much trump anyobody else’s on this board. God help RBW shareholders if I ever hit Sell Market. We’re looking at 12 cents with buyers lined up. lol
All jokes aside, we are in the a disgusting bear market – everything is a crapshoot folks. You know that when 18k shares change hands and stocks move 10-15%.
Alex no one cares how many shares you own of any stock…BMR, since we are still on delayed post you are obviously still screening them.
Db, watch your mouth before I decide to sell off my shares at market with Alex and demolish any hope you have of making $10 on the shares of rbw you have.
So db just so you know, you should care how many shares we have if you ever want to see rbw past 20 cents against.
Any other ridiculous comments you have?
Go rbw go!!!!
I sold off rbw so sell away (at a loss as im sure you two are getting close to holding the bag)!! Unlike you two im not scared to pull the trigger and take a profit…got a nice day trade in on it since though. As soon as it looked like RBW wasnt going to follow through with the International assays deadline it was time to move on…I may be back in to hold, I may not. I know you guys are frustrated cause you hold SOOOO many shares but posting idle threats on the internet just reeks of low self esteem and anger management issues…good luck with that!
Rainbow Resources Inc. has completed the first two holes of a Phase 1 reverse circulation drill program at the Company’s Jewel Ridge Property near Eureka, Nevada. This first phase of drilling is focused on the past-producing Hamburg Pit area. Each hole, drilled to depths of approximately 150 metres (500 feet), hit the contact zone between the Hamburg Dolomite and the Dunderberg Shale with intense silicification reported throughout each hole. Drilling is following up on some highly encouraging near-surface historical drill results in this area of Jewel Ridge including 2.1 g/t Au over 39.6 metres.
Jewel Ridge is located on the south end of Nevada’s prolific Battle Mountain – Eureka Trend, along strike and contiguous to Barrick Gold’s two-million ounce Archimedes / Ruby Hill mine to the north and the advanced-stage Lookout Mountain Project to the south. Jewel Ridge contains several historic small open-pit gold mines which align along a north-south trending stratigraphic contact of Lower Paleozoic sedimentary rocks, as well as several other gold mineralized zones with a variety of structural and lithological controls.
Significant results from recent work by Rainbow included chip samples across 15 metres from the south wall of the Hamburg pit (southern portion of Jewel Ridge) that assayed 0.98 g/t Au, 14.1 g/t Ag and 3.45 per cent zinc. A hematite float sample, believed to have originated from the Dunderberg mine area in the northwest section of the property, graded 3.6 g/t Au, 30.4 g/t Ag and 2.2 per cent lead.
The Jewel Ridge property consists of 96 unpatented lode mining claims and eleven patented claims covering approximately 1,510 acres. Rainbow can earn up to a 75-per-cent interest in Jewel Ridge as part of its option agreement with Greencastle, announced March 29, 2012.
VGN drilling program announced….