John: Stocks and indicies are in many ways just like people. They have finite lives and each one develops its own character peculiarities. Identification of these characteristics in people is left to the historians and biographers who toil often with a minimum of details whereas for stocks and indicies, which are usually analyzed by technical analysts, the required amount of information is both readily available and sometimes overwhelming thanks to computers and the Internet.
As one who spends many hours perusing charts looking for these characteristics, I am constantly reminded of what technical analysis really provides for its proponents. Some investors with some very basic knowledge of TA start to use it looking for the “Holy Grail” in the form of patterns or an indicator that will make them rich every time it performs in a certain way. These people are often soon disappointed after a series of mistakes at which they declare “TA does not work”. They should learn that the true purpose of technical analysis is to provide the investor with an awareness of a future probability and in no way does it foretell the future.
The Fibonacci targets that I portray on charts are based on theoretical mathematics associated with the Fibonacci series of numbers which occur frequently in nature, thus Fibonacci targets are a probability projection. A negative divergence, for example, between price and RSI is a warning that the relative strength of the present peak in price does not have the same strength as a previous peak and that the investor can expect weakness sometime in the near future.
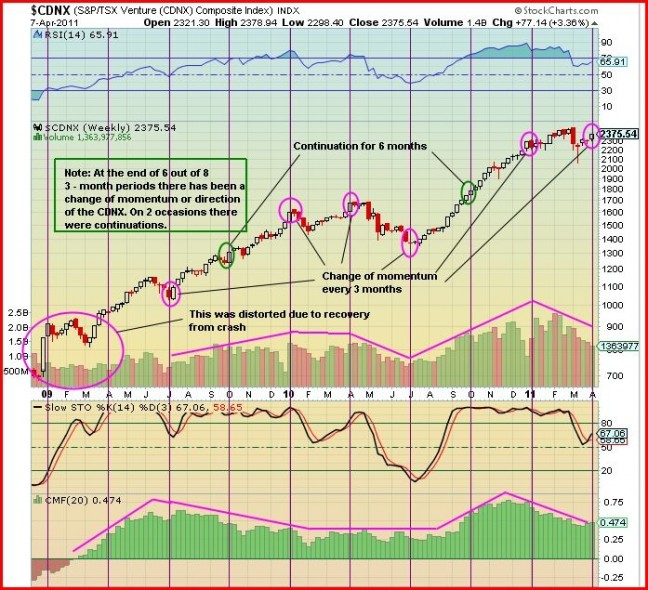
Tonight I’m using the “awareness” technique to analyze the TSX Venture Exchange using 3 charts. Chart #1 immediately below is a 27-month weekly chart of the CDNX. I have drawn vertical maroon lines at the beginning of each yearly quarter starting in January, 2009.
CHART #1
The first quarter (Q1) trading was distorted due to the recovery from the 2008 crash, thus it should be discounted. I noticed that at the beginning of each quarter after that, starting on April 1, 2009, there was a change in trading momentum in 6 out of the 8 following quarters. The only two occasions when a change did not occur was in October, 2009, and Oct., 2010.
Followers of BMR certainly noticed the abrupt change in momentum at the beginning of January this year from a bullish uptrend to a weakening in volume and buying pressure with a resultant mini sell-off and partial retracement.
Then on April 4, last Monday, there was another change to bullish momentum. What this analysis shows is that we must be aware of a probable change in momentum every 3 months in the CDNX, so based on that we can probably expect a bullish move until the end of June until Q3.
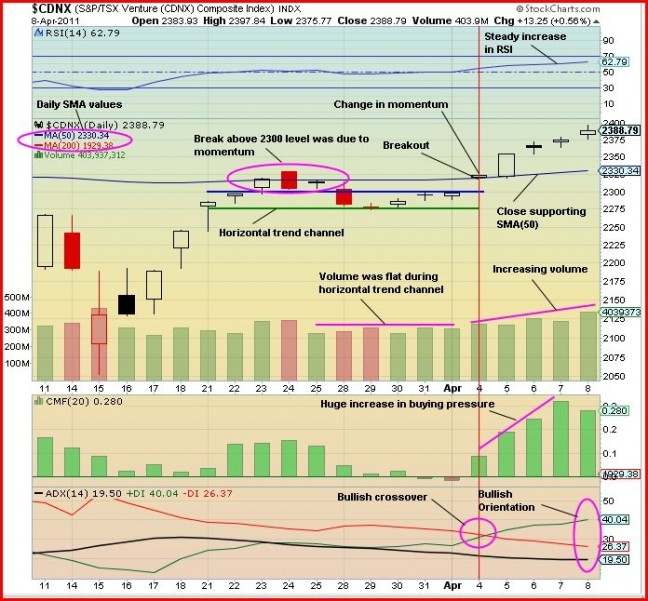
Chart #2 is a 1-month daily chart which shows that a breakout to the upside occurred Apr. 4 (vertical orange line).
CHART #2
The volume rose steadily during the week and the price continued to climb. Since the breakout the RSI has been on a steady climb and there has been a large increase in buying pressure. The ADX trend indicator shows a +DI crossover above the -DI on Apr. 4 and the trend is now in bullish orientation. The +DI is at 40, climbing and above the -DI at 26 which is falling. The ADX (black line) trend strength indicator is flat at a low value of 20. Good position at the start of a bullish move.
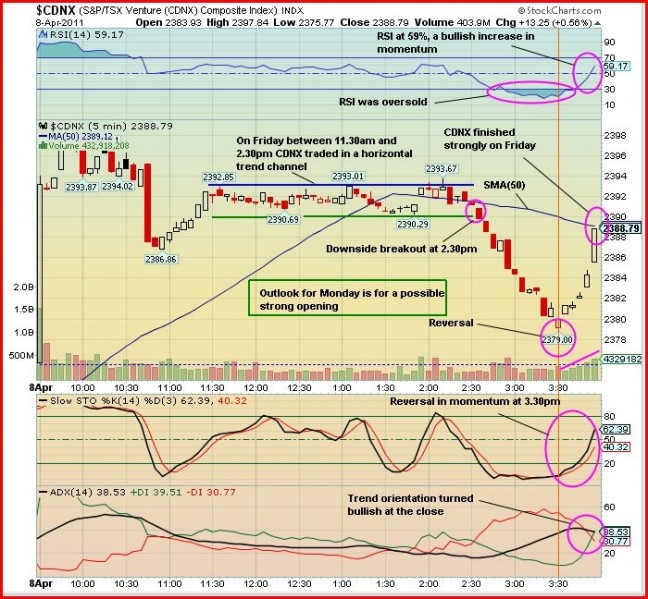
Chart #3 is a 1-day chart at 5-minute intervals (eastern time) for Friday, Apr. 8. The purpose of this chart is to have a look at what happened in trading and what it can tell us about what to expect Monday morning. On Friday, the CDNX gapped up at the open to 2384, rose to a high of 2398, fell to 2376 and then retraced and closed at 2389. It gained 13.25 points (0.56%) on volume of 403.9 million shares.
CHART #3
After a burst to the upside at the open, the CDNX consolidated until 2:30 pm at which point it broke to the downside from a horizontal trend channel. It fell to 2379 until 3.30 pm at which point it reversed to the upside to conclude the week with a strong 5-minute white candle at 2389, almost at the same level as the SMA(50) 5-minute interval moving average.
Looking at the indicators, the RSI was deep in the oversold region when at 3:30 pm it reversed and finished at a bullish 59%. Similarly, the Slow Stochastics (SS) reversed from an oversold situation to finish with the %K (black line) at 62% and the %D (red line) at 40% – bullish. The ADX trend indicator showed that the very short trend turned bullish at the close when the +DI crossed above the -DI.
With the very strong close Friday there is a good possibility of a strong opening Monday morning.


