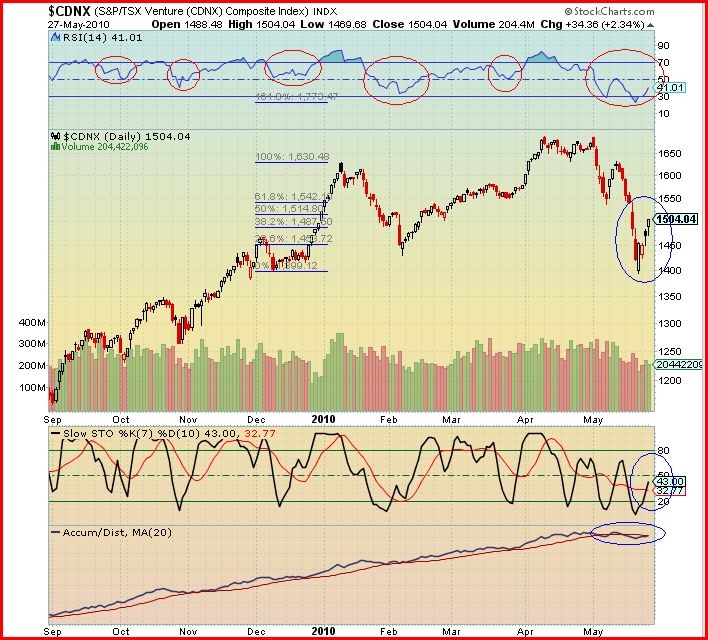
We correctly called the end of the recent CDNX correction earlier this week, and what normally happens after a major CDNX pullback is the exact opposite – this market has the potential to absolutely explode to the upside. In the span of just one week the technical picture has changed dramatically for the Venture Exchange and massive profits could be made in the weeks ahead for those who understand right now what’s likely unfolding here.
This morning, prior to the market open, BMR’s technical analyst takes a detailed look at the suddenly very bullish CDNX chart:
John: After Wednesday’s impressive gain, the CDNX made another strong move yesterday. At the open it gapped up to 1488, retreated during the day to a low of 1469, and then closed strongly at the high of the day – 1504 – for a gain of 34 points.
Looking at the chart, the CDNX is at a resistance level at 1500 but with the strength shown at the close yesterday (white candle with a shaved top) there should be no problem going higher today.
On the chart I have circled the candles at the reversal. We have two bullish reversal patterns there. The long red candle and the long white candle form a “bullish piercing pattern” and the long white candle and the short white candle create a “bullish reversal harami”.
The bottom of this correction occurred at the same level as a previous low in December, 2009, thus providing strong support for this reversal.
Looking at the indicators:
The RSI has climbed out of the oversold area and is moving toward 50%. It will be very bullish if this 50% line is crossed.
On the RSI I have circled several “W” formations. If you look at the price chart at these times, you will see a low has occurred and sometimes a consolidation. From these lows the RSI has always risen up again to the overbought region (i.e. above 70%). With this reversal the CDNX is on track to climb and make new highs.
The Slow Stochastics %K (black line) has crossed up above the %D (red line) – very bullish.
The Accumulation/Distribution line (A/C) shows the A/C line only dipped below the 20MA (red line) at the beginning of May (the start of the correction) and now is about to go back above the 20MA line – very bullish.
The Fibonacci levels are shown as blue bars with the target level being 1770.
Outlook: The outlook for the CDNX is very bullish, especially after yesterday’s strong move, with our target level now being a new high of 1770.

