After four straight losing sessions, the CDNX is once again at a critical technical juncture. The one positive sign over the last four trading days has been the very low volume. John, BMR’s technical analyst, reviews the current state of affairs below:
John: Again yesterday the CDNX displayed weakness, acting in concert with all other North American markets and dropping another 14 points. Gold did not provide any support.
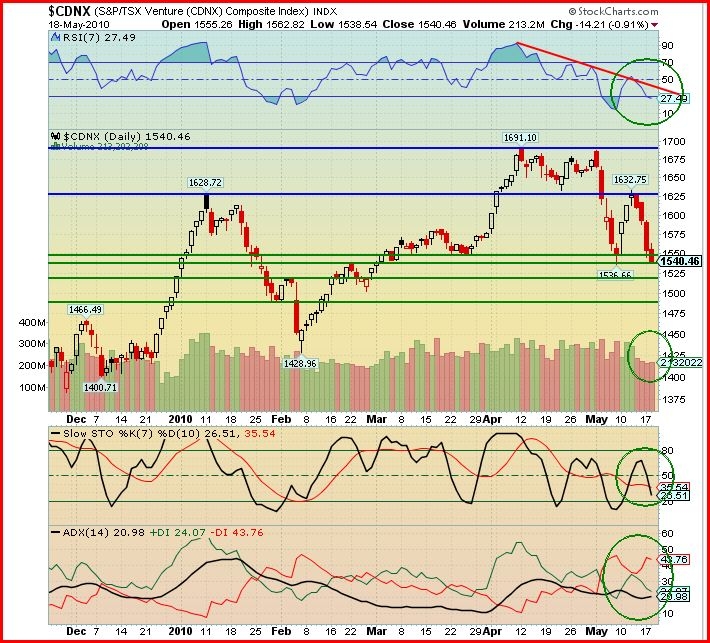
Looking at the daily chart, we see that over the first three days of last week the CDNX regained 61.8% of the previous week’s decline as shown by the Fibonacci levels (blue bars). Then on Thursday, Friday and Monday we saw a total retracement of that gain.
On the chart I have put in the resistance levels (long horizontal blue lines) and support levels (long horizontal green lines). On Monday we saw the CDNX reach a low of 1545, near Friday’s close, and then it bounced up to close at 1554. The top support level had held. Yesterday, the Index plunged through the top level of support and finished at the second level at 1540.
For what may happen in the near future we have to look at the indicators.
The RSI is falling and has moved into the oversold region which is below the 30% level. I have draw in a trend line (red) on the RSI that must be penetrated upward for any reversal to occur. There is no sign of a turnaround as yet.
The daily volume declining each day for Thursday, Friday and Monday, with yesterday’s volume only slightly higher than Monday’s, is a positive sign for a possible reversal in the near future. The daily volume over that four-day period was lower than the average daily volume. These points are important because the force of increasing volume when the trend is down would cause the Index to fall faster and further.
The Slow Stochastics shows that both the %K and the %D lines are below the 50% level and falling with no sign of turning up.
The ADX trend indicator has the ADX trend strength line flat at 20, so any trend is weak. The -DI (red line) is above the +DI (green line) indicating that the weak trend is bearish.
The outlook for the CDNX for the immediate future is to expect more downside and to expect one or more of the support levels to be tested. On the other hand, if we should suddenly see all of the other markets’ woes disappear overnight we could see a reversal today. Don’t count on it, however.

