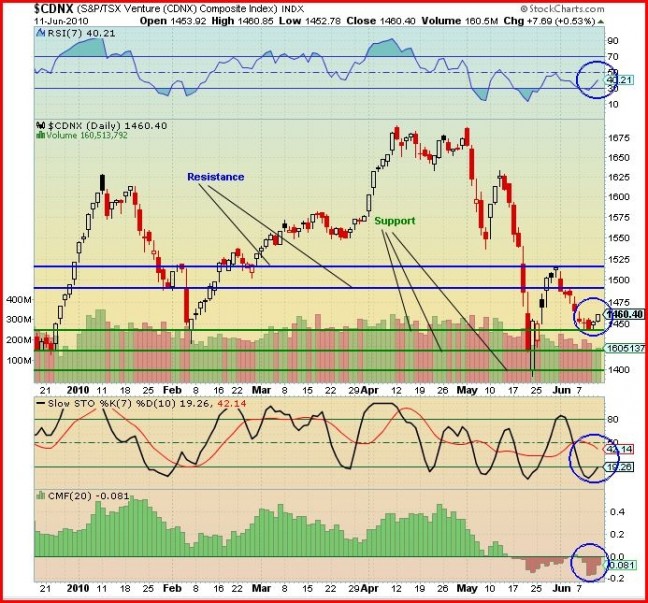
Despite general weakness in the overall markets the past couple of weeks, the CDNX has held above the yearly low of 1393 set May 21 which confirms our view that 1393 was an important bottom with a strong upside move on the horizon. BMR’s technical analyst sees some very bullish signs as explained with the updated chart and analysis below:

John: There were some significant technical developments with the CDNX this past week. Not only did it find support but there are signs of a possible bullish reversal.
Looking at the chart we see that on Tuesday the Index found support at the top green horizontal line. It tested and held this level Wednesday and Thursday. Then on Friday we saw a modest but nonetheless bullish move to the upside.
The major resistance lines are shown in blue while the support levels are in green. There are at the same levels as previous charts.
For this to develop into a major move up, the volume must increase. Volume was relatively low the past two trading days.
Looking at the indicators:
The RSI has moved up from just below 30% to the 40% level, a bullish sign.
The Slow Stochastics has the %K (black line) turning up at the 19% level and the %D (red line) turning down. This is bullish with a possible crossover expected this coming week.
The Chaikin Money Flow (CMF) indicator is still slightly bearish but is heading upward to the zero line and perhaps above. This is bullish.
The 20-day moving average (SMA), which has been in decline now for about 6 weeks, appears poised to reverse to the upside by the end of this coming week which is also a very bullish sign.
The outlook for the CDNX right now is very positive. The coming week will be a good test for confirmation of a bullish turnaround.
