The CDNX appears to be in free fall but this is NOT 2008 all over again. BMR’s technical analyst is watching closely for a “hammer reversal” . Below is John’s view of the situation going into Thursday’s trading:
John: The CDNX displayed more weakness today, falling a whopping 54 points, again pressured by the weakness in North American markets and the price of Gold which collapsed to $1,191 per ounce, a drop of $32.
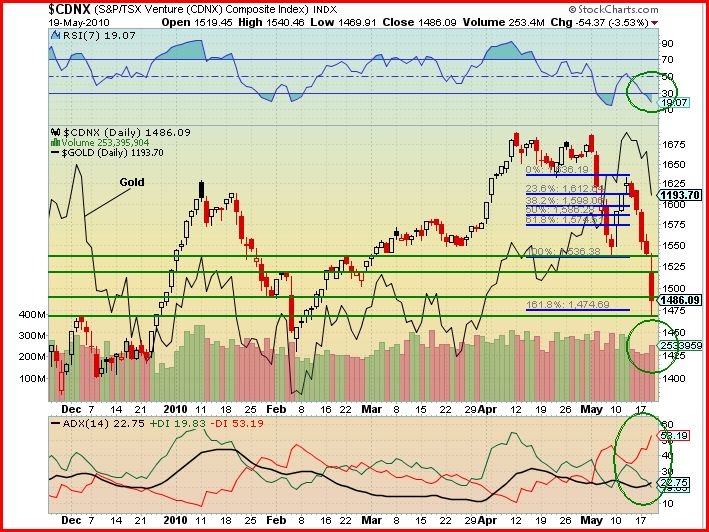
Today’s chart compares the CDNX with the price of Gold to view their relationship during the recent volatile period. The CDNX is the focus, so it’s shown in candle format while the price of Gold is displayed as a single black line.
On the chart I have drawn the CDNX support levels (long horizontal green lines). From Tuesday’s close (top green line) the CDNX plunged through the 2nd and 3rd support levels and stopped at the 4th support line before retracing 16 points to close at 1486.
On the chart I have shown the Fibonacci levels (blue bars) to determine the downward target of the 3 wave correction that has taken place over the last 13 trading days. The target is shown as 1474 – very close to the low of the day at 1470.
The 3 wave correction started on May 3rd and for 5 days the Index fell whereas the price of Gold rose, the CDNX being influenced by the weakness in the other North American markets. Then for three days the CDNX rose for a 61.8% retracement and the Gold price also increased. Then on May 12th, both peaked and since then both have continued to fall in concert.
For what may happen in the near future we have to look at the indicators.
The RSI has plunged deep into the oversold region (below 30%) and shows no sign of reversing direction. Maybe it has further to drop.
The volume yesterday was higher than each of the previous four days. This shows weakness, maybe some capitulation.
The ADX trend indicator has the ADX trend strength (black line) low at 22 (weak trend), slightly turning up, and with the -DI (red line) above the +DI (green line) the weak downward trend is gradually strengthening. However, the -DI is in a steep climb above 50 and should very shortly peak and reverse direction. This is a bullish sign that the bottom may be close.
Outlook for the CDNX : More downside is expected Thursday to test Wednesday’s low. Either Thursday or Friday I expect to see a “Hammer”.

