6:00 am Pacific
Two stocks in the BMR portfolio – Seafield Resources (SFF, TSX-V) and Colombian Mines Corporation (CMJ, TSX-V) – are major players in Colombia, searching for gold and copper, and both have done very well. Investors’ appetities are growing once again for companies exploring in Colombia which is regarded as a relatively safe jurisdiction for mining and exploration – “safer than Mexico”, one CEO recently told us. Colombia is a country blessed with abundant resources and the next decade down there could see some incredible growth in the mining sector. We’ve written a lot about Seafield recently. This morning, BMR’s technical analyst updates the outlook for Colombian Mines which is well established in that country with a very large land position, over 150,000 hectares:
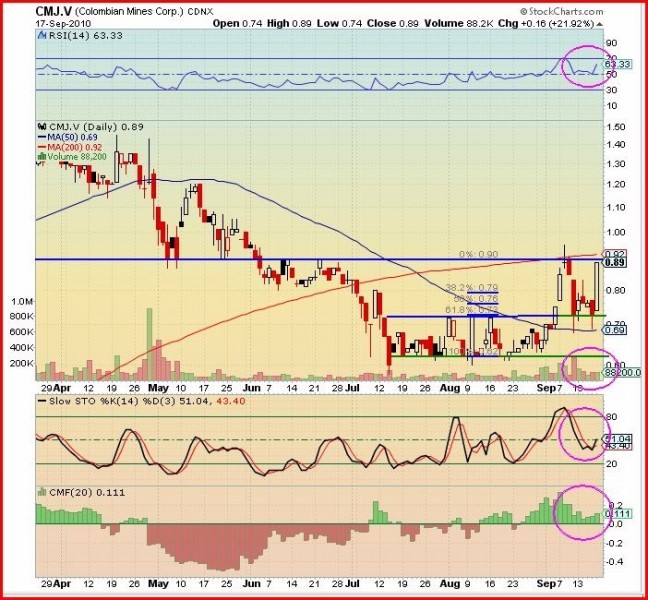
On Friday, Columbia Mines opened at 74 cents, its low for the day, and rose up to its daily high of 89 cents and closed there on relatively light volume of 88,000 shares. The company has only 23 million shares currently outstanding and 28 million fully diluted.
Looking at the 6-month daily chart, we see that between July 14 and September 3 CMJ consolidated between 60 cents and 73 cents in a horizontal trend channel (top blue line is resistance and the bottom green line is support). Then on Sept. 4 the stock broke to the upside and 2 days later rose as high as 95 cents but closed at 89 cents with a doji candle. This signalled an imminent reversal and a re-test of previous resistance.
Look at the RSI and the Slow Stochastic indicators at the high stock price. The RSI was at the edge of overbought and the Slow Stochastics was very high in the O/B. The candle and the indicators gave clear indication of an immediate reversal and in addition there is a resistance level right at 89 cents (blue horizontal line). The stock price retraced down to the Fibonacci 61.8% level (closing prices are more important than intraday) and consolidated until Friday when it rose once again to a high of 89 cents, right at the resistance level.
Looking at the indicators:
RSI retraced from the 70% level and formed a “W” formation and is now pointing up at 63% with plenty of room to move up – bullish.
The Slow Stochastics has completely unwound the O/B and has also formed a “W” formation at the 50% level – bullish.
The Chaikin Money Flow (CMF) indicator shows that following the high of 95 cents the buying pressure dropped off but has been increasing for the last 3 trading sessions – bullish.
Outlook: The stock appears poised to attempt to get through the 89 cent resistance level, perhaps this week. The indicators show that with sufficient volume the stock could move up to the next resistance level at $1.20. The stock’s medium to long term outlook is very positive. Investors with a near term outlook should wait for a close above 89 cents for confirmation of a breakout.

