Gold and Silver both tumbled significantly again today but some interesting developments occurred from a technical perspective with regard to the stocks – the CDNX found support at 2100 and rallied to finish the day at 2125, while for the fifth consecutive time in just over a year the TSX Gold Index tested its supporting 300-day moving average (SMA) and then headed higher. On a day when Gold was off over $20 an ounce, the TSX Gold Index lost ground in early trading, fell very slightly below its 300-day SMA, and then rallied to finish the day in positive territory – up 2 points at 385. The last time the TSX Gold Index did this was in late January of this year which presented a great buying opportunity in many plays. The CDNX showed bullish signs as well in bouncing off its lows.
Tonight, John takes a detailed technical look at both Gold and Silver. Both still need to unwind overbought conditions so one needs to be careful getting too excited if we see a bit of a rally after three straight days of heavy losses. However, the stocks may be sensing that lows aren’t far off in both Gold and Silver.
John: Tonight we’re taking a look at precious metals, specifically Gold and Silver. Right from the opening bell on Monday morning we saw the PM bears out in force driving down the prices in Gold and Silver. Through the first three trading days of the week, Gold has dropped $48 an ounce or 3% while Silver has fallen a whopping $8.55 an ounce or 18%.
One of the primary reasons for the reversal in Silver has been the main U.S. metals exchange, the CME Group, which raised margin level requirements three times in just over a week and some brokerages raised their margins even higher. This caused a panic with the Silver speculators who quickly fled the scene in droves.
The fundamentals with Gold and Silver are very complex and hard to analyze but I resolve that by using TA with chart patterns and indicators. We will take a look at two charts – Chart #1 is Gold (continuous contract) and Chart #2 is Silver (continuous contract).
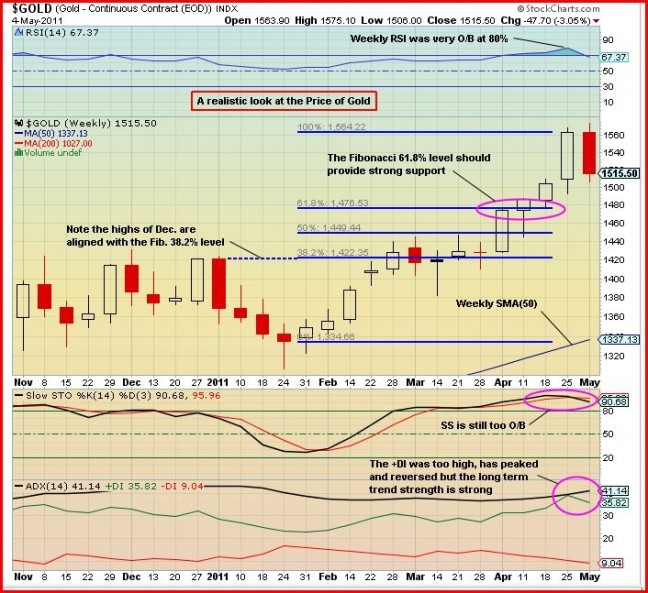
Looking at Chart #1 immediately below, we see that starting the week of January 31 Gold rose from about $1,335 an ounce to around $1,565 an ounce in a period of 13 weeks, an increase of over 17%. Then on Monday the price reversed and at the end of today’s trading Gold had retraced 21% of that move in just 3 days. The blue Fibonacci set shows that the first support is at the 61.8% level – $1,477. The other two Fibonacci support levels are at 50% ($1,449) and 38.2% ($1,422). A complete retracement would be to the $1,335 level. The 38.2% level is particularly strong as it coincides with the December highs.
CHART #1 – Gold
Looking at the indicators:
The RSI was very overbought at 80% and currently it’s at 67%, gradually unwinding. It should find bullish support at 50%. The Slow Stochastics (SS) is still too overbought with %K at 93% and %D at 97%. The ADX indicator shows the +DI has peaked and reversed but the ADX trend strength indicator shows the primary trend is still strong.
Outlook: Gold must unwind its overbought position. I expect it to test the Fibonacci 61.8% level at $1,477.
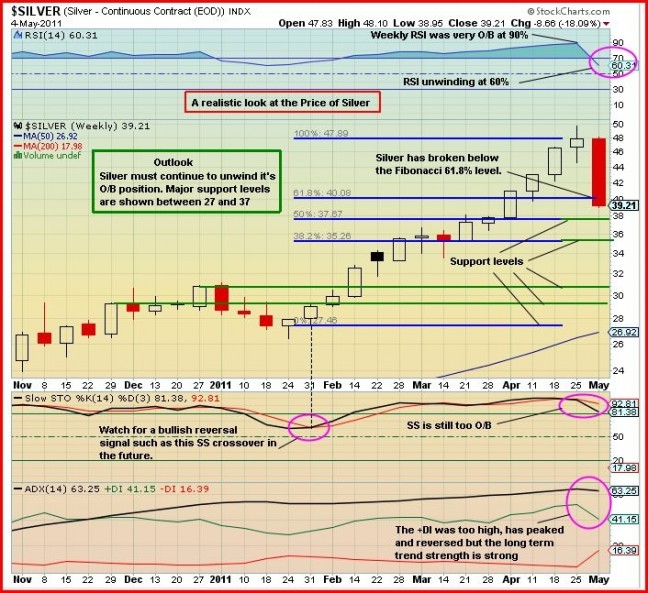
Now let’s look at Chart #2 – Silver (continuous contract). We see that this chart is similar to Chart #1 but Silver has fallen faster than Gold and has broken through the Fibonacci 61.8% level ($40.80), closing today at $39.21.
CHART #2 – Silver
From the week of Jan. 31, Silver rose from $27 to $48 in just 13 weeks – an increase of 78%. With this huge move it’s not surprising that it has fallen faster and further than Gold this week. Today Silver finished at $39 and appears ready to test the Fibonacci support levels at 50% ($38) and possibly 38.2% ($35).
Looking at the indicators:
The RSI was very overbought at 90% and is now at 60%. I expect it to find support between 40% and 50%. The Slow Stochastics is still too overbought with %K at 81% and %D at 93%. The ADX indicator shows that the +DI was too high, has peaked and reversed but the long-term trend strength is still strong.
Outlook: Silver must continue to unwind and 5 support levels are identified between $37 and $27. These charts should be used to monitor Gold and Silver prices. I expect both will find a support level and then consolidate before reversing to the upside. I will publish updated charts to keep everyone informed and point out what to look for with regards to consolidation and reversal signals. In the meantime keep an eye on the prices and their respective support levels.


3 Comments
can u do a cdnx chart?
Thanks John. Last weeks COT reports showed silver shorts were dropping like flies and then BOOM! Strange!!!!
Very strange with regard to the COT report as the commercial trades are hardly ever on the wrong side of the equation….it’ll be very interesting to see tomorrow’s updated positions…