At BMR, we look at a stock from both a fundamental and a technical perspective. We know all about the fundamentals driving Gold Bullion Development (GBB, TSX-V) – namely, the growing realization that this company is well on its way to discovering a potentially massive bulk tonnage, open-pit deposit at its Granada Gold Property 65 kilometres west of Osisko’s (OSK, TSX) 10 million ounce+ Canadian Malartic Deposit.
We expect a Granada exploration update from Gold Bullion by tomorrow (or Friday at the very latest). And the GBB chart confirms to us we can expect that this news is going to be good. John, BMR’s contributing technical analyst, updates us this morning (8:45 am Pacific time) on a possible imminent new upleg in Gold Bullion:

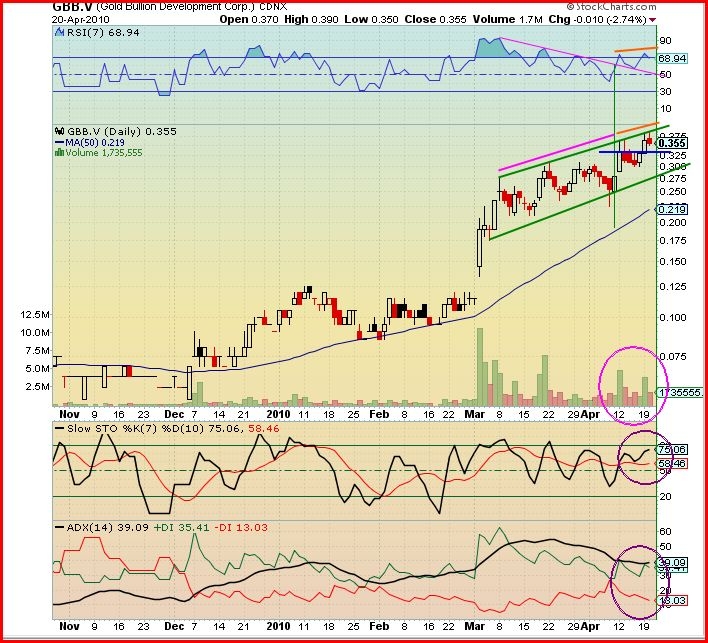
John: Gold Bullion rose yesterday to a new 52-week high of 39 cents where it met resistance and through the day declined to form a new strong base at 35 cents, finishing down a penny at 35.5 cents.
Looking at the chart we see that the stock is trading in an upward channel with the high of the day right at the top sloping resistance (green line). The horizontal blue line shows strong support at 33 cents.
A band of resistance is expected between 39 cents and 42 cents (Fibonacci target level). A move thru 42 cents raises the Fibonacci target considerably to above 60 cents.
On the RSI indicator a trendline is drawn (mauve line) indicating a weakness in strength but on April 8th prices rose and the RSI broke up through the trendline (vertical green line), bringing an end the divergence between the price and the RSI as shown by the sloping mauve lines.
The orange lines show price and the RSI both moving up in parallel, negating the negative effects of the divergence. Thus the stock is gaining strength every day.
Volume on up days is at least twice that of down days, a very bullish confirmation that the stock is gaining strength.
The Slow Stochastics %K (black line) did not cross down through the %D (red line) and is rising – bullish.
The trend indicator ADX is still in a very bullish mode with the ADX line (black) above the + DI line (green) which is above the -DI line (red).
GBB is trading near the top of its upsloping channel and with high volume and good news we could see the stock imminently move through the band of resistance and continue up above 42 cents.

2 Comments
Share price forecast:
April 22 High $0.385 Low $0.36 Close $0.385
April 23 High $0.65 Low $0.45 Close $0.61
April 26 High $0.60 Low $0.55 Close $0.58
April 27 High $0.62 Low $0.55 Close $0.56
April 28 High $0.60 Low $0.55 Close $0.57
April 29 High $0.66 Low $0.61 Close $0.66
As GBB did not break thru the Resistance level of 42 cents on Friday,
is the trend indicator still in a very bullish mode, where a move thru
42 cents could still be imminent? Thank you in advance for your reply.