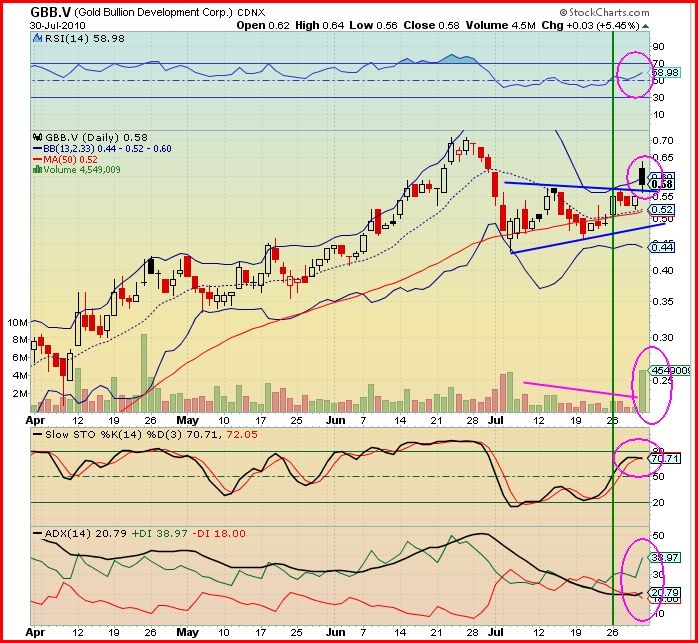
Gold Bullion Development (GBB, TSX-V) was the second most active stock on the CDNX today after releasing very significant news regarding its Granada Gold Property in northwestern Quebec. All of Gold Bullion’s moving averages (10, 20, 50, 100 and 200) are once again in bullish alignment with the 10 and 20-day SMA’s having just turned up after being in decline for most of the month. Tonight, BMR’s technical analyst – who made a great call on Gold Bullion just a week ago – updates the GBB chart and explains his reasons for being very bullish on this stock heading into August:
John: After yesterday’s groundbreaking news concerning Gold Bullion Development (GBB, TSX-V), investors opened their bank accounts and created an explosion of buying at the opening of trading today. Over 1.5 million shares changed hands in the first 15 minutes and more than 2.3 million after 30 minutes. Gold Bullion closed with a volume greater than 4.5 million shares on a day just prior to a long weekend. Fantastic. The stock gapped up at the open to 62 cents, an increase of 7 cents from Thursday’s close, climbed to a high of 64 cents, consolidated during the day with a low of 56 cents, and closed at 58 cents for a net gain of 3 pennies on the day (and 9 cents or 19% on the week).
Let us look at the 3-month daily chart to get a picture of what has happened here. We see that the trading in July has formed a symmetrical triangle (2 converging blue lines) and today GBB has had a breakout through the top line (black candle). When a stock breaks out from a chart pattern, it’s known as a “Breakaway Gap”. This breakaway gap was too powerful to be sustainable and essentially what happened was the stock proceeded to almost fill the opening gap with the day’s trading. Trading after the August holiday will be very interesting.
Looking at the indicators:
We see that the RSI is at 59% and climbing – very bullish.
From the beginning of July until today the average volume declined during the consolidation – bullish.
The Slow Stochastics has the %K (black line) and the %D (red line) almost together around 71 and turned down because of the gap up and the fact GBB closed near the low of the day – neutral.
The ADX trend indicator has the +DI (green line) above the -DI (red line) and climbing. With the ADX (black line) trend strength indicator turning up, together these confirm a strengthening bullish trend.
My previous update of the GBB chart was 1 week ago – July 23 – and below is what I wrote for the outlook:
Outlook: GBB is looking very bullish with all chart patterns and indicators expecting bullish volatility in the near future.
Key moments to watch for which will confirm a new bull run has started:
1) The prices closes above the SMA(13);
2) Daily volume >2 million shares;
3) RSI breaks above the 50% level.
The next 2 weeks are going to be interesting.
Looking at the chart, you can easily see that the 3 conditions for the start of a new bull run have been met (vertical green line) and, yes, it has been interesting.
The outlook for next week will be to look for good volumes, >1 million shares a day, and a steady increase in price as investors gain an even greater appreciation for the potential of this property after a long weekend of digesting Thursday’s news.

