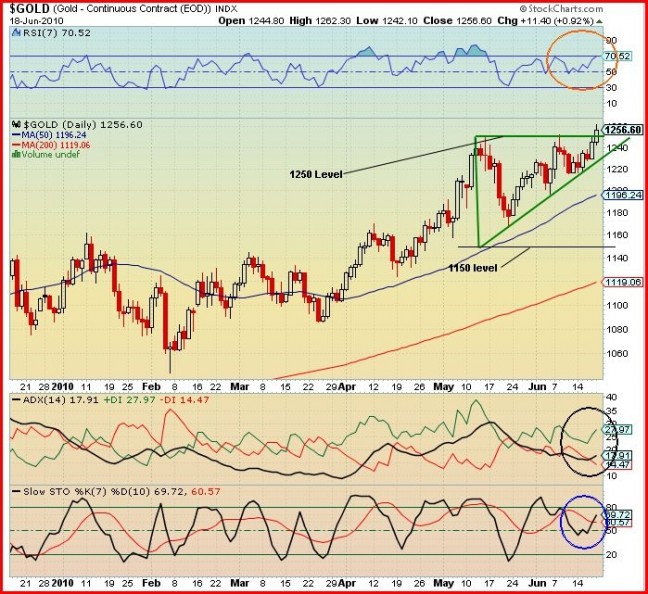
Gold hit a new record high Friday and next week should be extremely interesting to see how Gold behaves and tests this breakout. BMR’s technical analyst has a new short-term (4-month) target of $1,350 as explained in his chart update and analysis below:

John: The price of Gold (continuous contract) closed at $1,256.50 Friday after a record setting intra-day high of $1,260.30, reflecting the anxiety and uncertainty around the world seemingly in every phase of our lives.
The above daily chart shows an ascending triangle (green lines) formed over a period of 26 trading days starting May 12. The top green line at $1,250 was a resistance barrier that was tested 4 times but Gold did not close above $1,250 during that period. Friday that resistance was broken by a significant margin.
The test for this breakout will be if the Gold drops and bounces up off the $1,250 level, then the $1,250 level will be proven support.
What is the next Gold price target? One reliable measure is to add the height of the triangle to the top horizontal line of the triangle. In this case we have the height of $1,250 – $1,150 which equals $100. Therefore it’s reasonable to suggest the next target is $1,350 ($1,250 + $100).
Looking at the indicators:
The RSI is climbing but is not in the overbought region – bullish.
The ADX trend indicator has the ADX trend strength line low and turning up, confirming the trend is getting stronger. The trend is of course bullish because the +DI (green line) is above the -DI (red line). Note the +DI is climbing and the -DI is falling, a very bullish scenario.
The Slow Stochastics has the %K (black line) crossed over the %D (red line). The %K has a “W” formation below the 50% level and is still in the neutral zone below the 80% level – very bullish.
Outlook: The chart pattern and the indicators are bullish and all point to an increasing Gold price with a near-term (4-month) target of $1,350.
