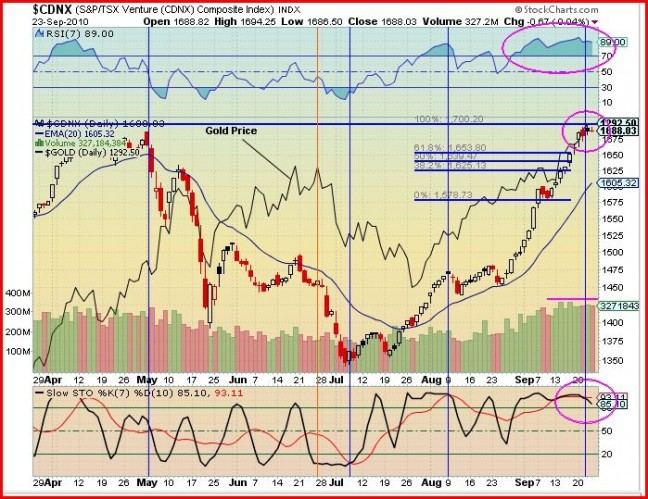
At BMR, not only do we consider the CDNX to be a major exchange exerting a significant influence in numerous sectors but we consider it to be an extremely reliable leading indicator with respect to precious and base metals. Tonight we will investigate the relationship between the CDNX Index and the price of Gold (continuous contract) and analyze the current situation with the CDNX with a view to the immediate future.
Let us start with a look at the 6-month daily comparative chart of Gold (continuous contract) and the CDNX. On this chart the CDNX is the focus in candle format with the price of Gold shown as a single black line.
Looking at the chart we see that up until May 1 both the CDNX and Gold were moving in tandem. At that point the CDNX started to decline from a high of around 1690 down to a low of 1343 during the first week of July. Gold, on the other hand, continued to climb until it peaked around June 25 (thin vertical orange line) and only then did it begin to decline, thus lagging behind the CDNX.
The CDNX bottomed out between July 4 and July 20 (ahead of Gold) and then started to climb, forming a 5 Wave Motive Phase as described on a previous chart. Gold declined to a low around July 26 and then reversed to start a new uptrend and continued to climb to its position today. We identified these very important and interesting developments in mid-July and alerted BMR readers to the strong possibility of an imminent major move in both Gold and the CDNX which is exactly what has occurred.
I have drawn four vertical blue lines to show how accurately the Slow Stochastics indicator can identify the CDNX tops and bottoms. During the last 3 days the CDNX trading has formed an “evening star” 3 candle pattern which is a top pattern indicating that a reversal could be imminent. This pattern has to be confirmed by indicators which we will see later. We also see that the volume over the past few trading sessions has been very high and the Index has not continued to climb, thus a sign of weakness. The bears are challenging the bulls.
On the chart I have shown a horizontal blue resistance line at 1700 and the Fibonacci retracement levels for Wave #5. We have previously stated that we do not expect any retracement to be more than approximately 5% (1700 x .05 = 85, thus a drop to about 1615 which is very close to the Fib. 38.5% retracement level of 1625 shown on the chart).
The daily EMA(20) provides strong support and the chart shows the Index has moved a long distance from this moving average. When that occurs a correction is required.
Looking at the CDNX indicators:
The daily RSI is high in the overbought region at 90% and has been overbought for the last 4 weeks. This supports the evening star candle pattern that a top has been reached and a correction can be expected. The Slow Stochastics is also overbought and the %K (black line) has crossed down over the %D (red line) above the 70% line, thus also supporting the evening star.
Outlook for the CDNX: The reversal candle pattern is confirmed by the positions of both indicators (RSI and Slow Stochastics), so a reversal on the CDNX chart is probable. This should be viewed as a healthy correction to alleviate the overbought conditions and the decline should not exceed the Fibonacci 38.2% retracement level (only a 5% pullback in the CDNX). The primary bullish trend remains firmly in place and after a minor correction the CDNX will continue on its march toward a possible new all-time high of over 3,300 as we believe the CDNX is in the midst of a move of historic proportions.
How should traders and investors approach the current situation? Thursday’s Morning Musings summed that up very well:
“Our macro view, as we have already outlined, is that the CDNX is in the midst of a bull market run of historic proportions, so the next 6 months look extremely bullish…rather than try to time the market’s moves from week to week, in an environment such as this the wisest strategy is to keep holding high quality junior mining stocks and also have some cash available for buying on any dips whenever they may come.”

