We’ve gotten to know Gold Bullion President/CEO Frank Basa pretty good the last several months. One thing he likes to do, which is an admirable quality, is under-promise and over-deliver. If he tells you, for example, he has a deposit with a grade of 1.2 g/t Au, you can take that to the bank – and then some. He has consistently under-promised and over-delivered with Gold Bullion these last few months. Which is why we believe next week’s news could send this stock soaring well beyond its all-time high of 39 cents.
Based on our exhaustive research and three days at the LONG Bars Zone last month, this is what we believe: A multi-million ounce gold deposit exists at Granada. Gold Bullion has hunted a good part of that down already. They will start drilling the property again like crazy in just a few weeks and by the end of the year they’ll have a preliminary 43-101 in hand to prove just how big this really is. By then of course the stock could be exponentially higher than it is now and perhaps even a takeover target.
Genuine opportunities like Gold Bullion right now are rare but when they do appear, the risk-reward ratio is extremely attractive. The potential returns are mind-boggling. In our view Gold Bullion is a major discovery in the making, in the best jurisdiction in the world for mining, which is why insiders haven’t sold a single share since drilling began last December.
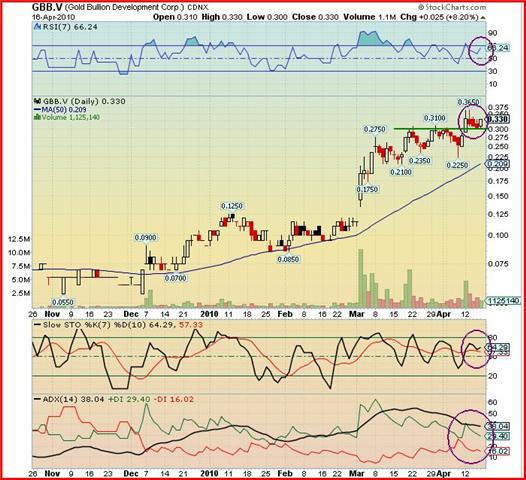
We’ll be reporting more on Gold Bullion Monday. In the meantime, take a look at the chart and comments below from John, BMR’s contributing technical analyst. The chart is confirming everything we’re saying about the fundamentals that are driving this stock. If you’re looking for a classic, textbook example of incredibly bullish price and volume patterns – signs that a stock is about to explode and go on a LONG run – look no further than Gold Bullion and the chart below:

Up, up and away she goes…GBB’s chart is hugely explosive.
John: The daily chart for GBB shows that this week the stock stepped up to a new level and formed a new base.
On Monday the stock opened at 29 cents with a gap-up from the previous Friday’s close of 28 cents and climbed to a new 2010 high of 36.5 cents. Failure to close the gap or even drop below 30 cents shows the strength of this move.
For the remainder of the week we saw consolidation with a new support level established at 30 cents (horizontal green line). Friday afternoon saw more buying pressure with the stock closing at its high for the day, 33 cents.
The price is well supported with all of its moving averages in bullish alignment (the chart shows the steadily rising 50-day SMA).
The RSI shows a strengthening as the indicator turned up on Friday (mauve circle).
The volume shows bullish behavior with rising volume on up days.
The Slow Stochastics %K (black line) did not cross down through the %D (red line) – bullish.
The ADX trend indicator shows all three lines are rather flat due to the consolidation but they are in a bullish order. That is, the ADX (black line) is above the +DI (green line) which is above the -DI (red line).
The outlook for GBB is very bullish as shown by the chart and the indicators.

1 Comment
Do you know the Opening Price of Osisko in 2006 the day they released
their Model and the stock went from, I understand 30 cents to 75 cents
that day? Thank you.