Gold is coming off its best weekly advance since 2013, rising nearly 5% and reaching its highest level since early October. Investor holdings of Gold in exchange-traded products have posted the longest continuous increase since 2012, thanks to a myriad of factors including global growth concerns, a weakening U.S. dollar, the Oil price collapse, geopolitical hotspots and struggling equity markets with the NASDAQ already down 13% this year.
 Keep in mind, too, that China continues to strongly support the physical side of the market. In 2015 China consumed more than 90% of the total annual global output of Gold, and in December the country imported 180 tonnes from Switzerland alone. That was an 86% increase over December 2014.
With a 10.5% jump in just the first 25 trading sessions of 2016, Gold is so far this year’s most beloved global asset. That’s a far cry from the beating it took from many pundits, especially in the U.S., during 2015.
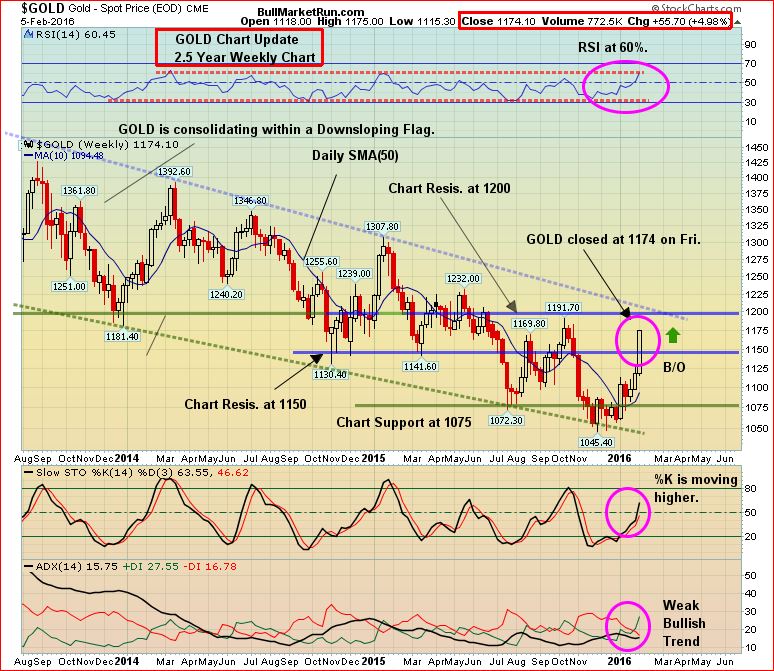
Tonight’s chart from John has been an amazingly accurate guide for the direction of Gold over the past few years. Each time the yellow metal has hit the bottom of the channel, it has bounced back vigorously which is why we turned bullish on bullion in November and recommended going long on the HGU (double long Gold stock ETF) around $3 ($15 post-consolidation, it closed Friday at $26), in addition to high quality Gold producers, near-producers and explorers.
On our 2.5-year weekly chart, Gold is now up against RSI(14) resistance – 60% – where it has turned away from on previous occasions in 2014 and 2015. It’s possible this time could be different. Significantly, the Gold price has yet to reach the top of the downsloping flag which leaves a potential $40 or so on the upside over the near future after Friday’s close at $1,173. A general band of resistance stretches from $1,175 to the low $1,220’s.
Investors love to chase and a lot of people, including fund managers, are just waking up to Gold’s momentum. This is why it wouldn’t be surprising to see bullion mount a vigorous challenge to the top of the downsloping flag around $1,200 before a healthy pullback to unwind temporarily overbought conditions. At the time when $1,200 becomes new support and Gold starts to gain traction above that key level, that’s when everyone will start talking about a new Gold bull market.

