New Gold Inc. (NGD, TSX) is one of our favorite Gold producers and completed an astute transaction earlier this year when it bought out Richfield Ventures and its Blackwater deposit in central British Columbia.
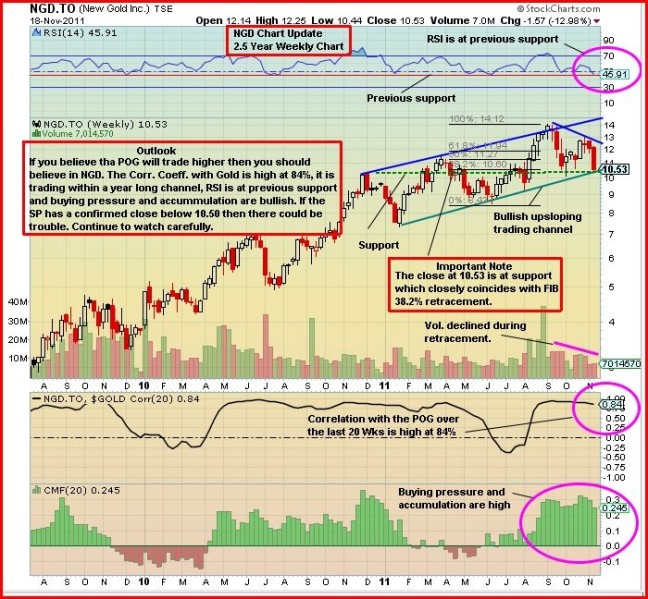
John’s latest NGD chart (2.5-year weekly) is highly interesting. While there are no guarantees in this business, a review of the current NGD chart gives a strong buy signal. These are the kind of technical conditions one should look for in a stock to make money in the market.
As the saying goes, buy into weakness and sell into strength. NGD fell $1.57 for the week, or 13%, to close Friday at $10.53. The 100, 200, 300, 500 and 1,000-day moving averages all continue to rise. Overall, this is a beautiful chart and suggests Gold’s bull market continues.


1 Comment
NGD
Support for NGD is $9.85